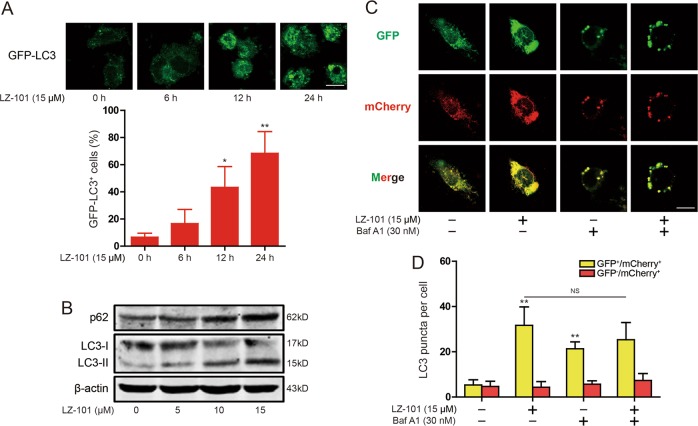
Fig. 5. LZ-101 blocked autophagy flux in A549 cells.
a Induction of GFP+ dots in A549 cells expressing GFP-LC3 treated with 15 μM LZ-101. Images of individual cells and quantified of GFP-LC3+ cells. Scale bars, 10 µm. b p62 and LC3 were detected by western blot in A549 cells treated with 15 μM LZ-101. c A549 cells expressing mCherry-GFP-LC3 were observed under a confocal microscopy after 15 μM LZ-101 and 30 nM bafilomycin A1 treatment. Representative images are shown. Scale bars, 10 µm. d The average numbers of yellow or red puncta were obtained from three countings. Data are presented as mean ± SD. *P < 0.05, **P < 0.01 compared with DMSO group

