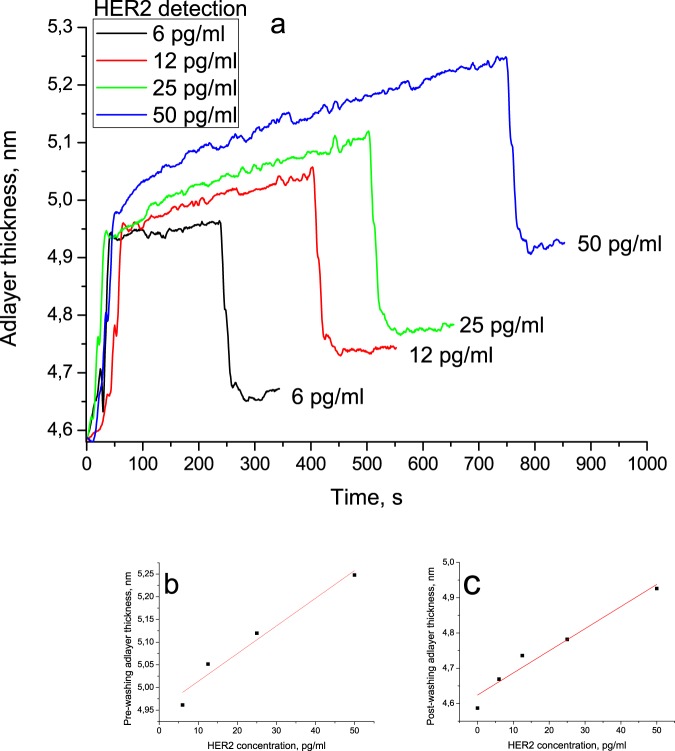
Figure 5.
Quantitative detection of HER2 antigen using photonic crystal surface mode detection. (a) The dependence of the adlayer thickness increase and decrease on the HER2 concentration; after the start of the HER2 flow, the signal was allowed to reach a plateau (pre-washing adlayer thickness); then, the solution was switched to PBS to begin the washing stage; the washing stage was marked with a rapid decrease in the signal intensity until it reached a new plateau (post-washing adlayer thickness). (b) The linear dependence of the pre-washing adlayer thickness on the HER2 concentration. (c) The linear dependence of the post-washing adlayer thickness on the HER2 concentration (the value before HER2 binding taken to be the zero point).

