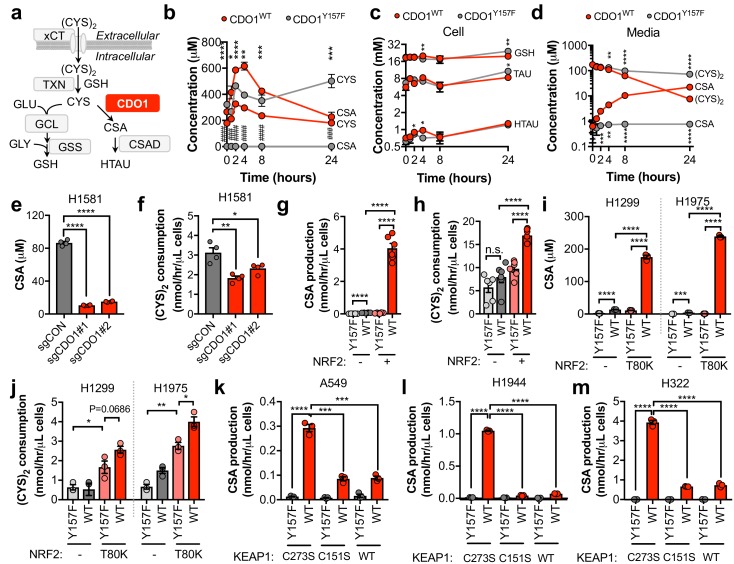
Figure 4. CDO1 depletes cyst(e)ine, leading to its export as CSA.
(a) Schematic depicting intracellular cysteine metabolism. Following uptake of cystine via xCT, it is reduced to cysteine via the cellular antioxidant systems. Cysteine then enters glutathione synthesis mediated by GCL and GSS, or undergoes irreversible metabolism by CDO1 to CSA, and subsequently to HTAU by CSAD. (b) Time-dependent quantification (0, 1, 2, 4, 8, 24 hr) of intracellular cysteine (CYS) and cysteine sulfinic acid (CSA) concentrations following medium replenishment of CDO1WT-expressing (red) and CDO1Y157F-expressing (gray) A549 cells. *= CDO1WT vs. CDO1Y157F CYS, #= CDO1WT vs. CDO1Y157F CSA. N = 3 replicates/group, except 8 hr CYS for which N = 6 replicates/group. (c) Time-dependent quantification of GSH, HTAU, and TAU in the extracts from (b). N = 3 replicates/group. (d) Time-dependent quantification of the levels of (CYS)2 and CSA in the medium from the cells from (b). N = 3 replicates/group. (e) Intracellular CSA concentration of H1581 cells following expression of control (sgCON) or CDO1-targeting sgRNAs (sgCDO1 #1 and #2) and Cas9. N = 4 replicates/group. (f) Quantification of (CYS)2 consumption from the medium of the cells from (e). N = 4 replicates/group. (g) CSA production rate of NRF2 KO A549 cells reconstituted with either pLX317 empty (NRF2 -) or pLX317-NRF2 (NRF2 +), followed by expression of CDO1Y157F (Y157F) or CDO1WT (WT). N = 6 replicates/group. (h) Quantification of (CYS)2 consumption from the medium of the cells from (g). (i) Intracellular CSA concentration in H1975 and H1299 cells expressing either pLX317 empty (-) or pLX317-NRF2T80K (NRF2T80K), followed by expression of CDO1Y157F (Y157F) or CDO1WT (WT). N = 3 replicates/group. (j) Quantification of (CYS)2 consumption from the medium of the cells from (i). (k–m) CSA production rate of A549 (k), H1944 (l) and H322 (m) cells following expression of CDO1Y157F (Y157F) or CDO1WT (WT), and reconstituted with inactive KEAP1 (C273S), super repressor KEAP1 (C151S) or wild-type KEAP1 (WT). N = 3 replicates/group. For (g–m) cells were treated with 0.25 μg/ml doxycycline for 2 days prior to and during the assay and fresh medium was added 4 hr prior to sample collection.


