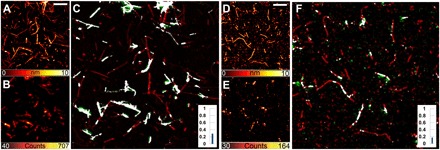
Fig. 3. Insulin fibrils at dye-to-protein ratios of 1:99 and 1:499.

Insulin fibrils obtained from 1:99 (A to C) and 1:499 (D to F) dye-to-protein ratios. AFM images (A and D), STED microscopy images (B and E), and correlative images (C and F). Several fibrils are totally unlabeled, while a homogeneous fluorescence is emitted by some other aggregates. The ratio of colocalization is shown by the histograms (C and F, insets). Scale bars, 2 μm.
