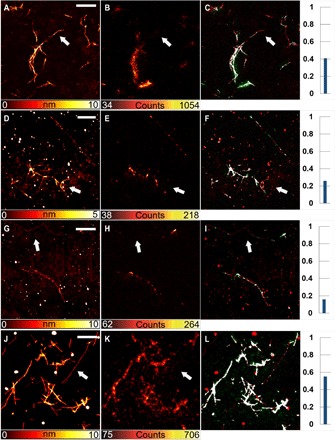
Fig. 4. Correlative images of fibrils from Aβ.

Amyloid aggregates from Aβ1–42 (A to I). Different concentrations of fluorescent peptides were present. The dye-to-protein ratios were 1:19 (A to C), 1:99 (D to F), and 1:499 (G to I). In addition, at the higher dye-to-protein ratio (A to C), some fibrils were not displayed by fluorescence images (e.g., see the white arrows). For amyloid aggregates from Aβ1–40, the dye-to-protein ratio is 1:19 (J to L). Scale bars, 2 μm.
