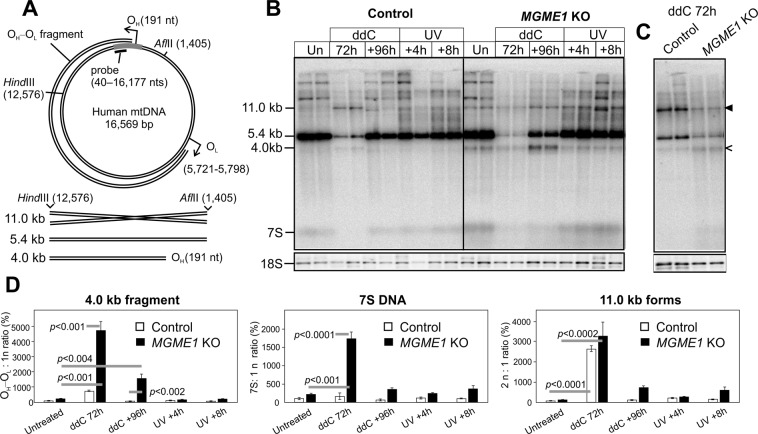
Figure 2.
Replication stalling induces mtDNA double-strand breaks. (A) A schematic illustration of human mtDNA showing the linear deletion spanning between OH and OL, restriction sites, the probe location and the resulting restriction fragments detected by the probe. In AflII-HindIII digested samples, the probe will detect a 5.4 kb full-length mtDNA fragment, a 4.0 kb fragment originating from the OH–OL species and 7 S DNA. As x-forms are twice the size of the full-length AflII-HindIII fragment, they will migrate at 11.0 kb on an agarose gel in the absence of ethidium bromide. (B) Southern blot of AflII-HindIII digested total DNA from ddC or UV treated control and MGME1 knockout cells, probed for mtDNA as indicated in (A). In the case of ddC experiments, the cells were first exposed to ddC for 72 h to achieve maximal replication inhibition and then left to recover for 96 h. UV-treated cells were harvested 4 h or 8 h after exposure. MGME1 knockout (KO) cells have high levels of the 4.0 kb subgenomic fragment, representing the OH–OL species, and the 7 S DNA, but also a 11.0 kb molecular species corresponding to the abundant x-forms present in the samples (Fig. 1D). This 11.0 kb band appears also in the ddC -treated parental HEK293T cells (black arrowhead). While UV exposure increases the heterogeneous high molecular weight forms, it does not influence the levels of 4.0 kb fragments, 11.0 kb molecules or 7 S DNA. Additional bands larger than 11.0 kb represent partially cut mtDNA due to the ribonucleotide blockage of restriction sites63. The 18 S signal of nuclear DNA is given as a loading control. (C) Digest of parental HEK293T and MGME1 knockout samples after 72 h ddC treatment as in (B), but with four-fold more DNA compared to (B). 4.0 kb fragments (open arrowhead) are present at low levels also in the parental control cells. The black arrowhead indicates 11.0 kb forms. (D) Quantifications of the various forms normalized against the full-length mtDNA in each sample and standardized against the corresponding levels in the untreated control (100%). Results are presented as mean ± SD and p-values are obtained from one-way ANOVA with post-hoc Tukey HSD Test. Note that the 47-fold increase in the 4.0 kb fragment at 72 h ddC samples of MGME1 KO masks the difference between the knockouts and controls in the untreated samples. In principle, the 4.0 kb fragment is below detection level in untreated control cells and its increase in the quantification is relative to the background in the corresponding lanes. Therefore no p-value is given for the comparison of untreated and 72 h ddC treated control samples.

