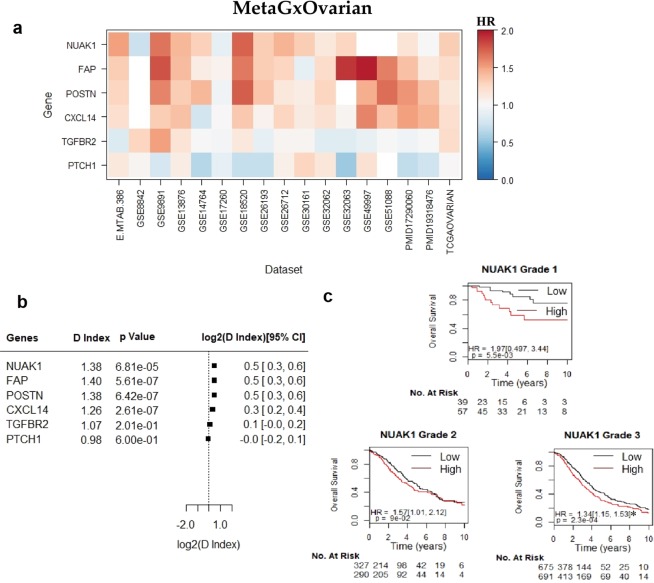
Figure 4.
Assessment of the prognostic value of six key genes in ovarian cancer, using the MetaGxOvarian package. (a) Heatmap representation of hazard ratios for each gene, across 17 datasets. The estimate is presented as a hazard ratio for each gene. Ratios greater than 1 (red) indicate worse prognosis for elevated expression levels of that gene in the respective datasets. (b) Random effects meta-estimates of the hazard ratios for each gene, calculated by pooling the hazard ratios from each individual dataset. (c) Kaplan-Meier curves of NUAK1. Each KM plot represents patients of a specific tumour grade. Within each plot, patients are split into ‘high’ and ‘low’ based whether they fall above or below the median NUAK1 gene expression. The asterisks above the D indices indicate whether the D index was statistically significant (p < 0.05).

