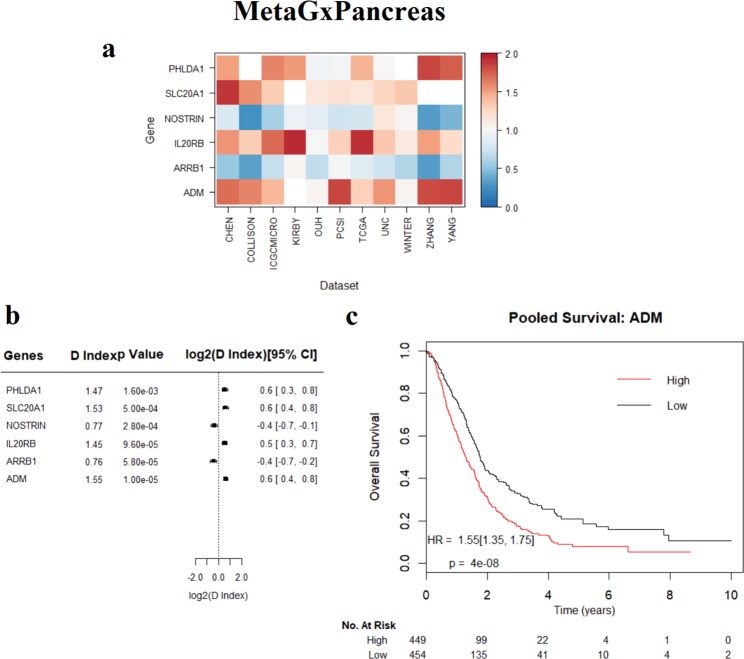
Figure 5.
Assessment of the prognostic value of genes in pancreatic cancer, using the MetaGxPancreas package. (a) Heatmap representation of hazard ratios for each gene, across 11 datasets. The estimate is presented as a hazard ratio for each gene. Ratios greater than 1 (red) indicate worse prognosis for elevated expression levels of that gene in the respective datasets. (b) Random effects meta-estimates of the hazard ratios for each gene, calculated by pooling the hazard ratios from each individual dataset. (c) Kaplan-Meier curve of ADM.

