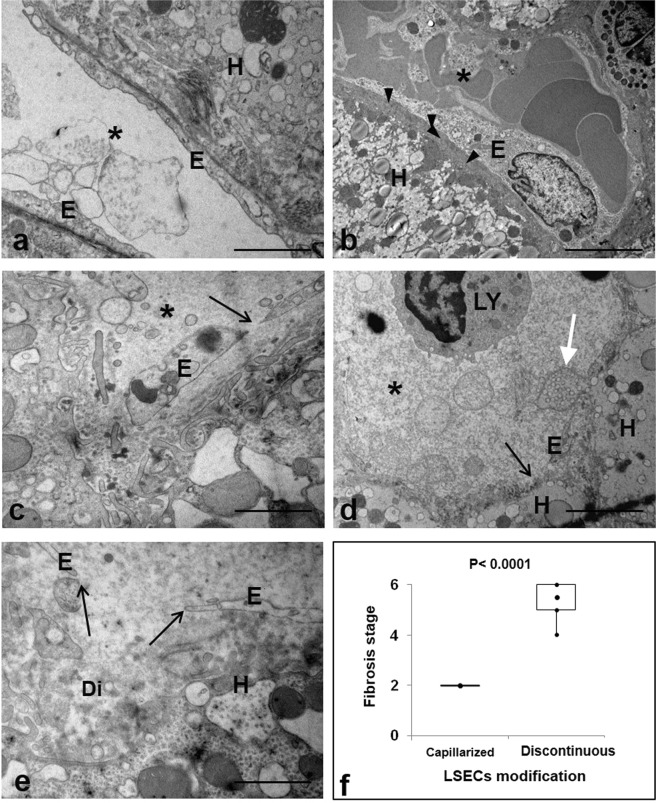
Figure 2.
EM analysis of sinusoidal modifications in HCV-infected liver. (a,b) Representative electron micrographs of capillarized LSECs. The absence of fenestrae and the development of a continuous lining (a) with the appearance of abnormal basement membrane (arrowheads) on the basal side of LSECs is shown. (c) The micrograph shows the swelling of sinusoidal endothelium (E), and the presence of large gaps (arrows). (d,e) Images show variable degrees of discontinuous endothelial lining leading shedding of hepatocytes vesicles (white arrow) into the sinusoidal lumen (asterisk) and to a widening of the space of Disse (Di). (f) Box Plot representing the distribution of capillarized and discontinuous LSECs according with fibrosis stage (Ishak scoring system) in HCV-infected liver. (H) hepatocytes; (*) sinusoidal lumen. Scale bars: a,e = 1.2 μm; b–d = 5 μm.

