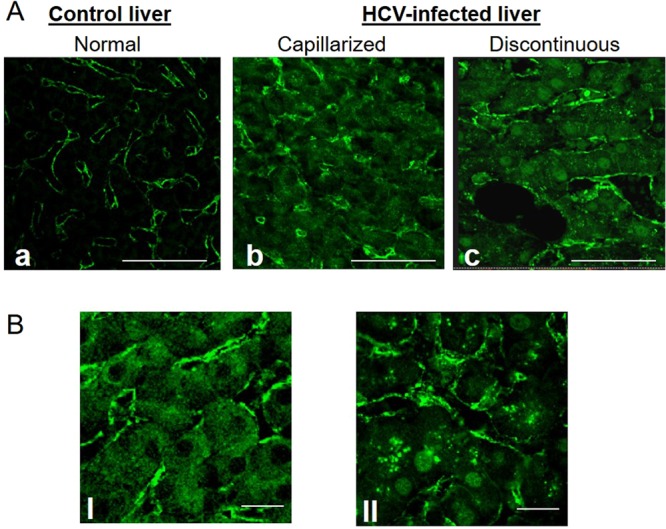
Figure 5.

Confocal microscopy analysis of caveolin-1 (CAV-1) distribution. (Panel A) Normal liver (a) exhibits lack of CAV-1 expression in hepatocytes, while positive staining is restricted to the sinusoidal endothelial cells surface. In HCV-infected liver (b,c) the labeling is present both on hepatocytes and endothelial cells. (Panel B) Representative confocal images showing different staining pattern into parenchymal cells: the staining was found as absent in the nucleus and diffuse in the cytoplasm (I), or positive in the nucleus and present as puncta in the cytoplasm (II). Scale bar; A (a–c) = 25 μm; and B (I,II) = 12 μm.
