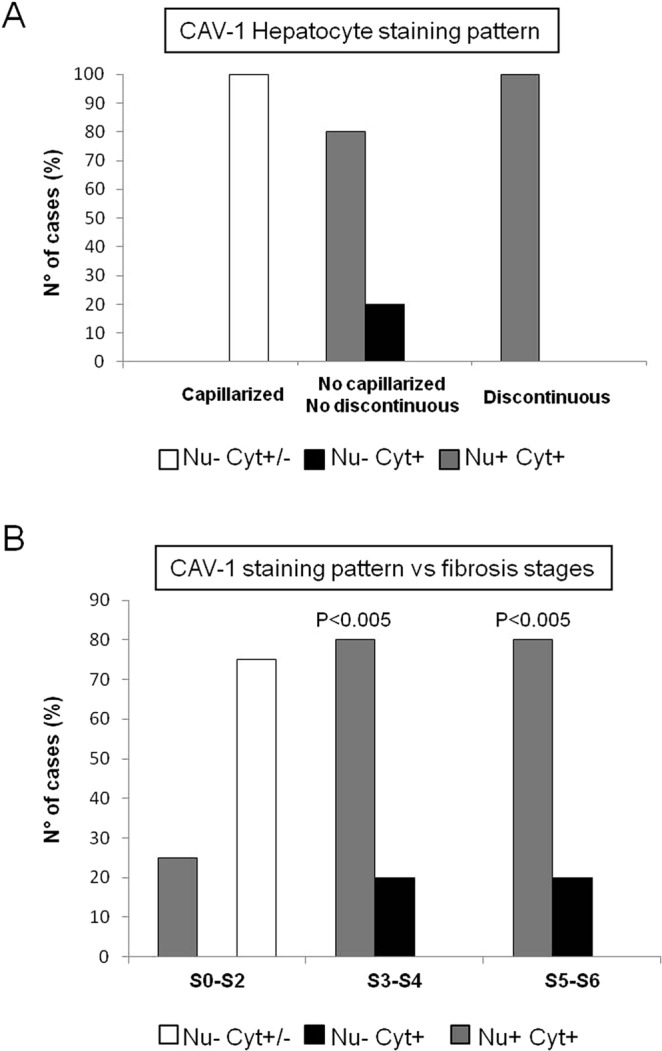
Figure 6.

Distribution of CAV-1 staining pattern into hepatocytes. (Panel A) Distribution of the staining pattern in hepatocytes of HCV-infected liver according to the different LSECs modifications. (Panel B) Distribution of CAV-1 expression pattern according to fibrosis stages. Protein expression was analyzed by Chi-square test. A statistically significant association was found between CAV-1 nuclear expression and S3–S6 (P < 0.005; CI 95%).
