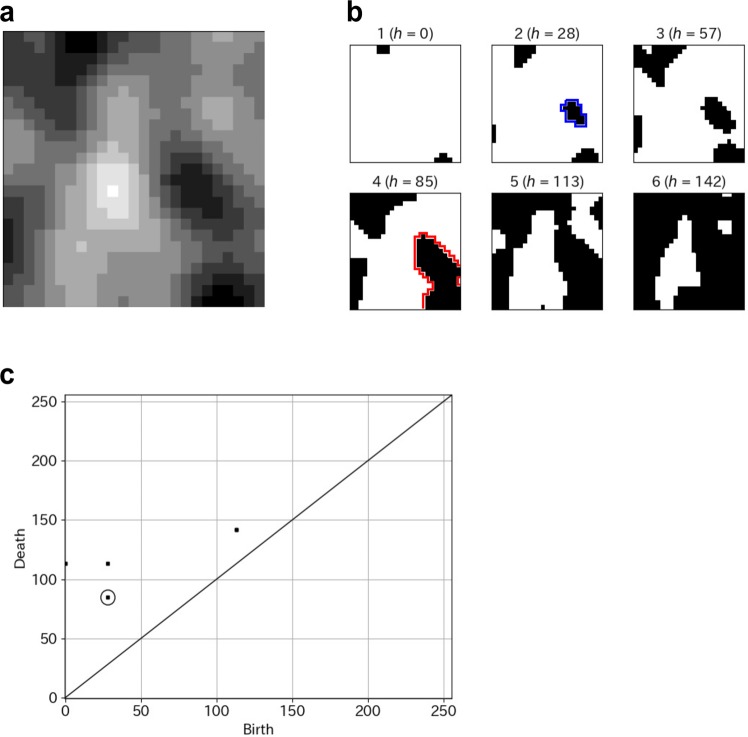
Figure 3.
(a) A gray-scale image. (b) Filtration of binary images (h, threshold gray-scale value). A sequence of binary images is obtained by changing the threshold. The area surrounded by the blue line represents an example of the birth of a connected component. The area surrounded by the red line represents the death of the connected component. (c) Persistence diagram (degree 0). The point in the circle corresponds to the birth–death described above a pair of the connected component.

