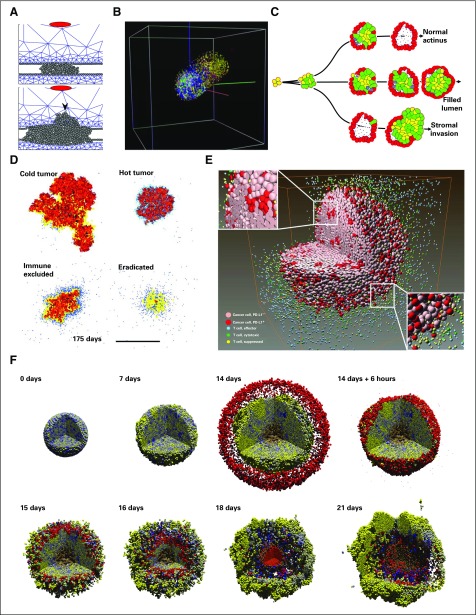
FIG 5.
Cancer invasion and immunosurveillance. (A) In a center-based model, signals secreted by stromal cells (red) induce tumor cells (gray) to degrade the basement membrane and invade the stroma (blue mesh). Adapted with permission from Kim et al.80 (B) A three-dimensional (3D) cellular automaton (CA) model to study selection in heterogeneous brain cancers. Cells could mutate their signaling network parameters, which leads to more invasive clones. Adapted with permission from Zhang et al.81 (C) An immersed boundary method of contact-based signaling and polarization in breast acini.82,83 Cells with altered signaling could fill the lumen or invade the stroma. Adapted with permission from Anderson et al.82 (D) A 2D CA model of tumor-immune interactions. Immune cells (blue dots) become exhausted after too many successful tumor cell kills and create fibrotic tissue (yellow). Tumor encapsulation, tumor elimination, and chronic response are observed in the model. Adapted with permission from Kather et al.84 (E) A sophisticated 3D CA model of treatments targeting programmed cell death-1 (PD-1) and programmed death ligand 1 (PD-L1) in cancer cells. (PD-L1+ cells express PD-L1; PD-L1− cells do not.) Reprinted with permission from Gong et al.85 (F) A 3D center-based model of immune responses to an immunostimulatory factor in a heterogeneous tumor (shaded by immunogenicity; yellow cells are most immunogenic). Immune cells (red) seek and adhere to cancer cells, test for immunogenicity, and induce apoptosis. The immune response failed after immune cells aggregated near a local maximum in the signaling factor, which allows the tumor to repopulate. Adapted with permission from Ghaffarizadeh et al.21 This work was explored further with high-performance computing.10

