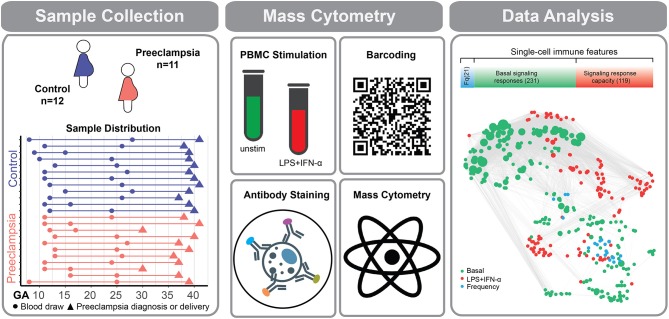
Figure 1.
Experimental workflow for the deep profiling of immune system dynamics in preeclampsia. Eleven women with preeclampsia and 12 healthy (normotensive) women were studied. PBMCs were obtained at two time points during the first 28 weeks of pregnancy. Sample collection time (dots), preeclampsia diagnosis (orange triangles), or delivery (purple triangles) are indicated for individual preeclamptic patients (orange lines) and controls (purple lines). PBMCs were either left unstimulated or stimulated with a cocktail of LPS and IFN-α. Immune cells were barcoded, stained with surface and intracellular antibodies and analyzed with mass cytometry. The assay produced three categories of immune features, providing information about cell frequency (Fq) measured in 21 immune cell subsets (blue bar), basal intracellular signaling activity (green bar), and cell type-specific signaling capacity in response to stimulation with LPS and IFN-α (red bar). The number of immune features contained within each data category is indicated in parentheses. Correlation network reveals the relationships between immune features within and across mass cytometry data categories. A correlation network highlights the relationship between measured immune features (Spearman's coefficient).

