Figure 2.
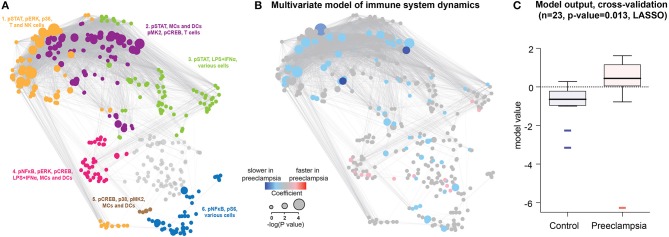
Predictive modeling of immune response dynamics associated with preeclampsia. (A) The correlation network segregates into 6 major communities of correlated immune features. Communities were detected using the Louvain multi-level modularity optimization method (33, 34) and annotated on the basis of immune feature characteristics (signaling property, stimulation, or cell subset) most commonly represented within each community. (B) A predictive multivariate model built on immune feature dynamics (rate of change between the first and second time points). LASSO identified patients that develop preeclampsia within 12–14 weeks after the last sampling time. Red/blue dots highlight immune features that evolve faster/slower in preeclampsia compared to Control. Dot size indicates the –log 10 of p-value of model components compared between preeclamptic women and controls (Student t-test). (C) Boxplots showing model prediction for controls and preeclamptic women (AUC 0.803, cross-validation p-value = 0.013).

