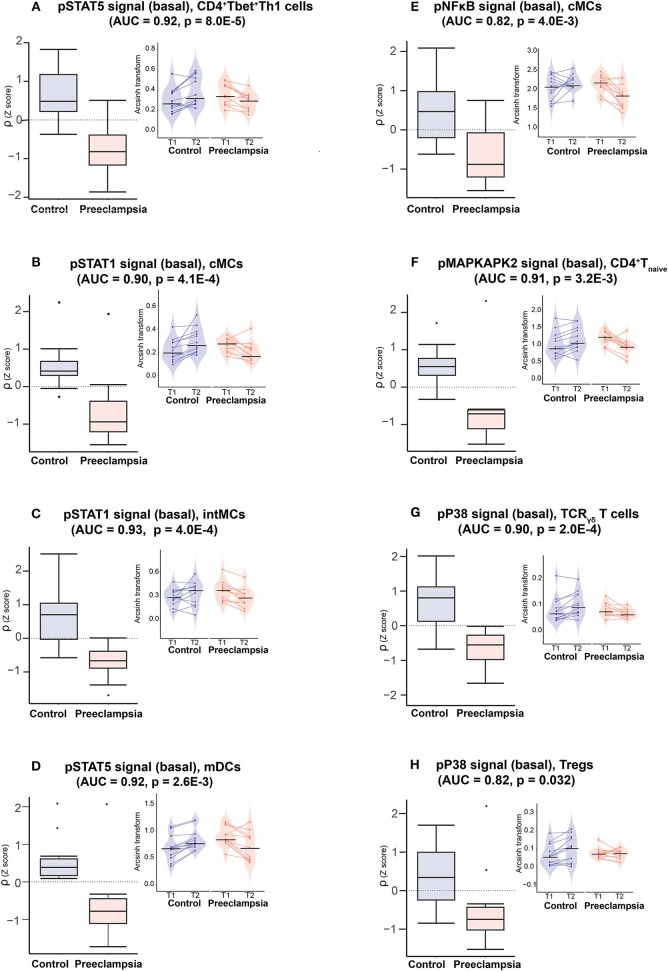
Figure 4.
Model components reveals disrupted innate and adaptive immune cell dynamics in preeclampsia. Boxplots (left panels) depict the rate of change (ρ) of indicated immune feature for the eigth most informative model components. AUC and p-values are indicated on each graph (ROC analysis). Insets (right panels) depict immune feature values (arcsinh transform of the mass cytometry intracellular signal mean intensity) at individual time points (T1, T2) and for each patient. Color code: purple = controls, orange = preeclampsia.

