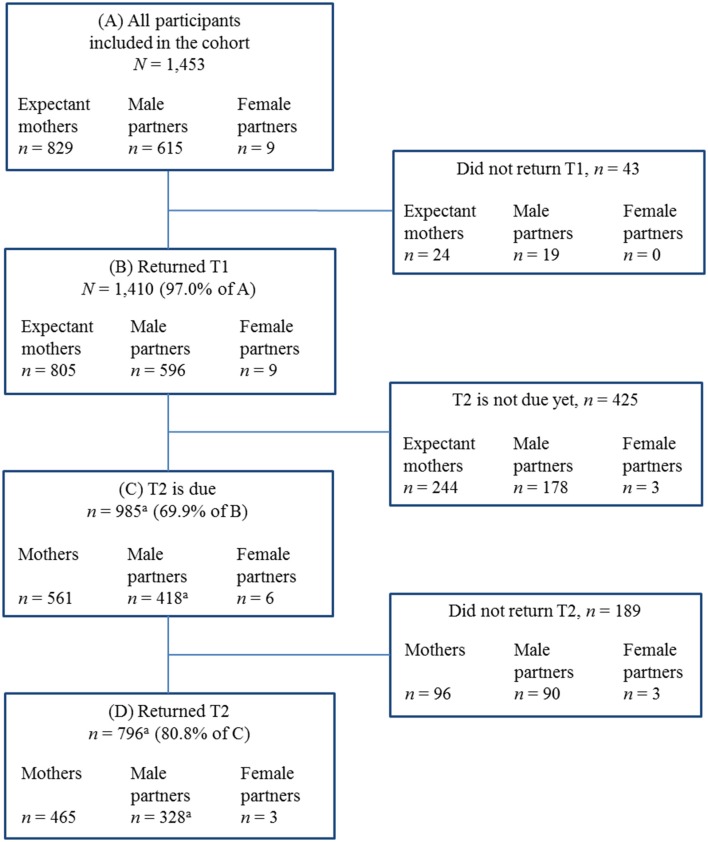
Figure 3.
Flow chart of the DREAM study. Notes: T1 during pregnancy, T2 8 weeks after anticipated birth date. Data from end of September 2018 (data collection is not finished yet, recruitment ongoing). Further future assessment waves (not due yet): T3 14 months and T4 2 years after actual birth date (prolongation into middle childhood planned). aMale partners' sample includes one male partner who did not return T1 but returned T2.

