Figure 3.

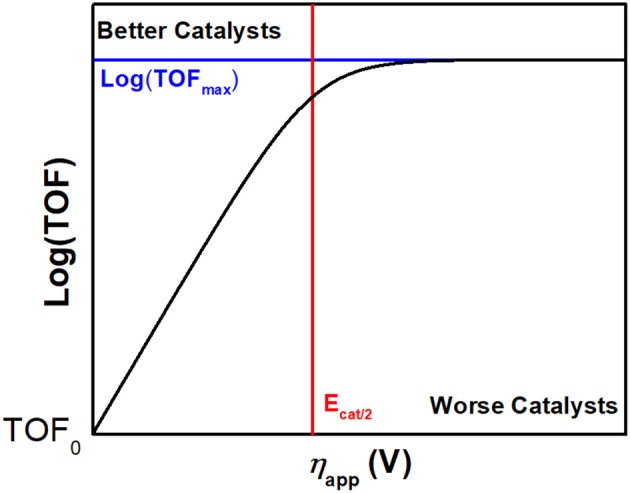
Example of a catalytic Tafel plot of a generic molecular species with regions where better and worse catalysts are located explicitly labeled, along with the position of important benchmarking parameters.

Example of a catalytic Tafel plot of a generic molecular species with regions where better and worse catalysts are located explicitly labeled, along with the position of important benchmarking parameters.