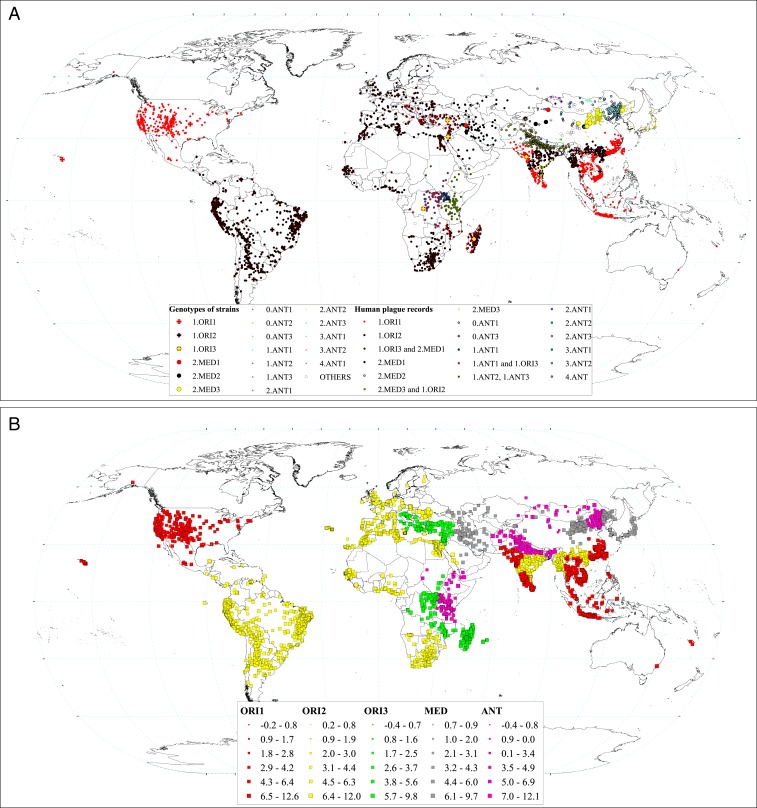
Fig. 1.
(A) Spatial distribution of plague spread during the Third Pandemic. Small points indicate locations with human plague appearance, with colors indicating suspected plague genotype. The suspected genotypes are listed in the legend. We identified the suspected genotype by matching with the nearest surveillance site with genotype data based on samples from patients, hosts, and/or vectors. Surveillance sites are shown by large points, circles, and triangles (see legend: Genotypes of strains). (B) Estimated spreading velocity of plague by using the g-NNA. Colors indicate 1.ORI.1, 1.ORI.2, 1.ORI.3, ANT, and 2.MED strains. The sizes of the symbols show the spreading velocity (kilometer per year in ln-transformed scale).

