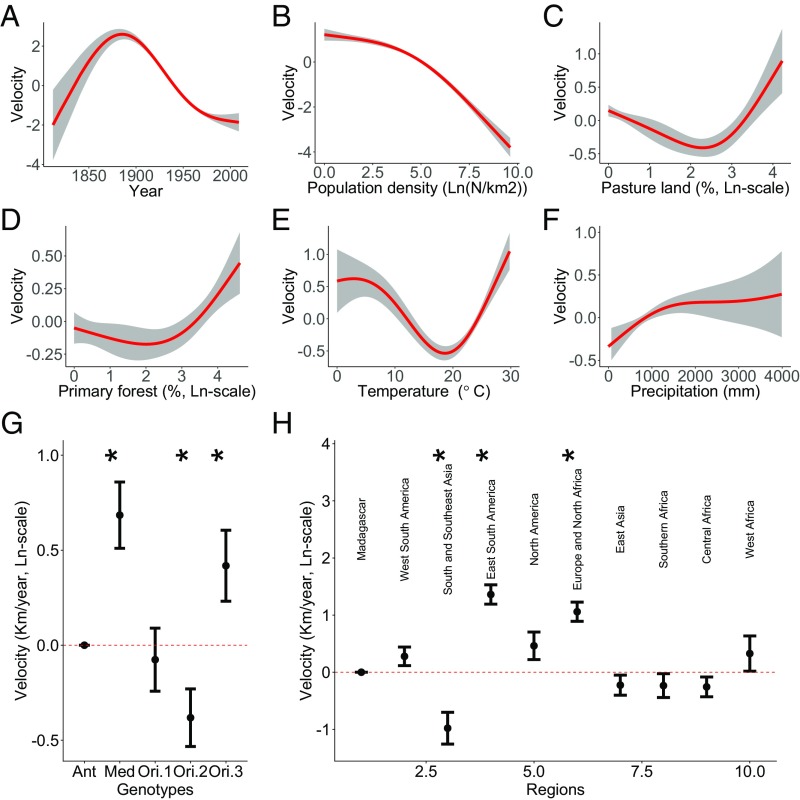
Fig. 2.
Effects of different environmental variables on velocity of plague spread based on results of the final model selected (SI Appendix, Table S1). (A–F) Partial effects of continuous predictor variables on plague spread velocity [ln(km⋅y−1)]. Gray bands are 95% nominal confidence bands. Red lines are statistically significant (P < 0.05). (G) Partial effects (±1 SE) of the categorical variable Genotypes, with ANT as reference level. (H) Partial effects of the categorical variable Regions, with Madagascar as reference level. Asterisks mark the significant genotypes and regions (P < 0.05) in G and H.

