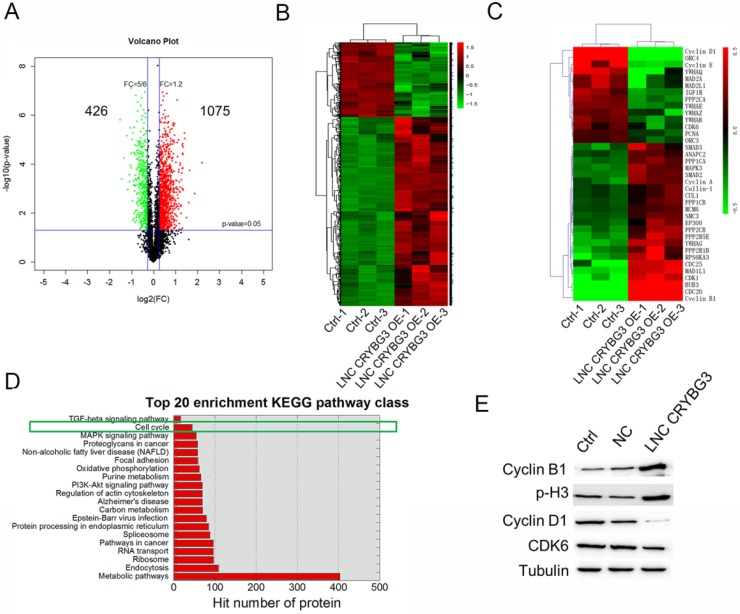
Figure 1.
Protein expression profiles in A549 cells treated with LNC CRYBG3. (A) Volcano plot indicates the number of up- or down-expressed proteins after LNC CRYBG3 overexpression. (B) The heatmap displays of total differentially expressed proteins after overexpressed LNC CRYBG3. (C) The heatmap displays of differentially expressed proteins in cell cycle pathway. (D) Top 20 enrichment KEGG pathway class was shown when cells were overexpressed LNC CRYBG3. (E) The protein makers of cell cycle were confirmed by western blot after LNC CRYBG3 overexpression.

