Figure 1.
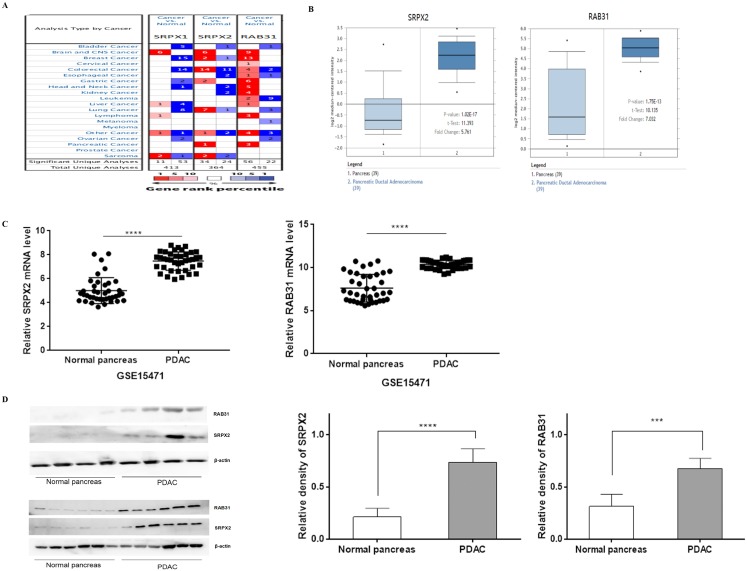
SRPX2 and RAB31 are upregulated in pancreatic cancer. (A) mRNA expression of genes in cancer tissue versus normal matched tissue. Up and down regulated expression of target genes shown in red and blue, respectively. Color transparency shifted in the top 1% and top 10% in both up and down regulated gene expression. The number in each square denotes the number of analyses that satisfy the threshold. (B) Representative SRPX1 and RAB31 mRNA expression in pancreatic tumor tissues versus normal samples from the Oncomine database. The p-value was set as 0.01 and fold change was defined as 2. (C) Representative SRPX1 and RAB31 mRNA expression in pancreatic tumor tissues versus normal samples from the GEO database. (D) The expression level of SRPX1 and RAB31 was significantly upregulated in pancreatic cancer tissue compared to that in the adjacent noncancerous tissue (WB: P < 0.001). ****P < 0.0001, ***P < 0.001, *P < 0.05.

