
Figure 3.
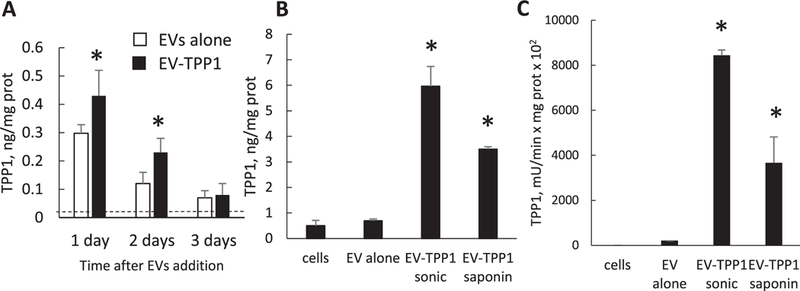
Delivery ofTPPl to CLN2 cells with EVs. CLN2 cells were treated with A) either EV-TPP1-t (black bars) or EVs from sham macrophages (white bars) for various time intervals, or B,C) EV-TPP1-l produced using sonication or saponin permeabilization for 6 h. Following treatments, CLN2 cells were lysed and the A,B) TPP1 protein levels were determined by ELISA or C) TPP1 activity was measured using AF-AMC (400 × 10−6 M) as a substrate. Dashed line—TPP1 protein levels in untreated CLN2 cells (A). Treatments with all EV-TPP1 formulations resulted in significant increases in the enzyme levels in CLN2 cells. Statistical comparisons of (A) EV-TPP1-t treated versus untreated cells or (B,C) cells treated with EV-TPP1-l versus empty EVs: *p < 0.05, (n = 4). (A) Difference between EV-TPP1-t and empty EV treated cells is not significant.