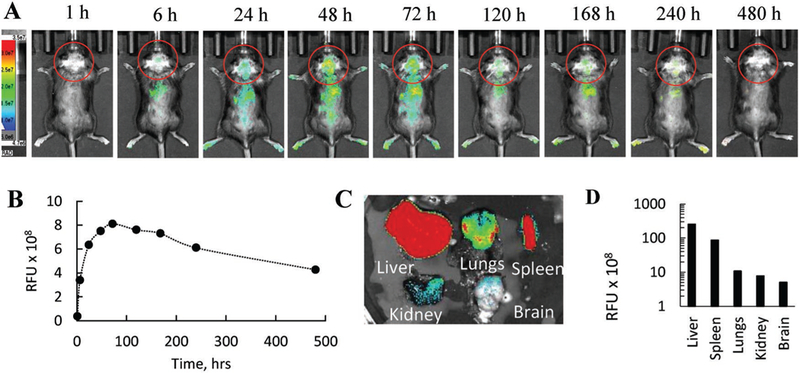
Figure 5.

Biodistribution of EVs in LINCL mice by IVIS. LINCL mice (1 month old) were injected with DiR-labeled EVs through i.p. route. Animals were imaged over 20 d by IVIS. A) Representative images from N = 4 mice per group (dorsal planes) taken at various time points demonstrate prolonged brain accumulation of EVs in LINCL mice. B) Quantitative analysis revealed maximal brain accumulation at day 3 with slow decrease of the EVs fluorescence levels over 3 weeks. C,D) Postmortem imaging of organs indicate significant EV accumulation in the organs decreasing in order: liver > spleen > lungs > kidney > brain.
