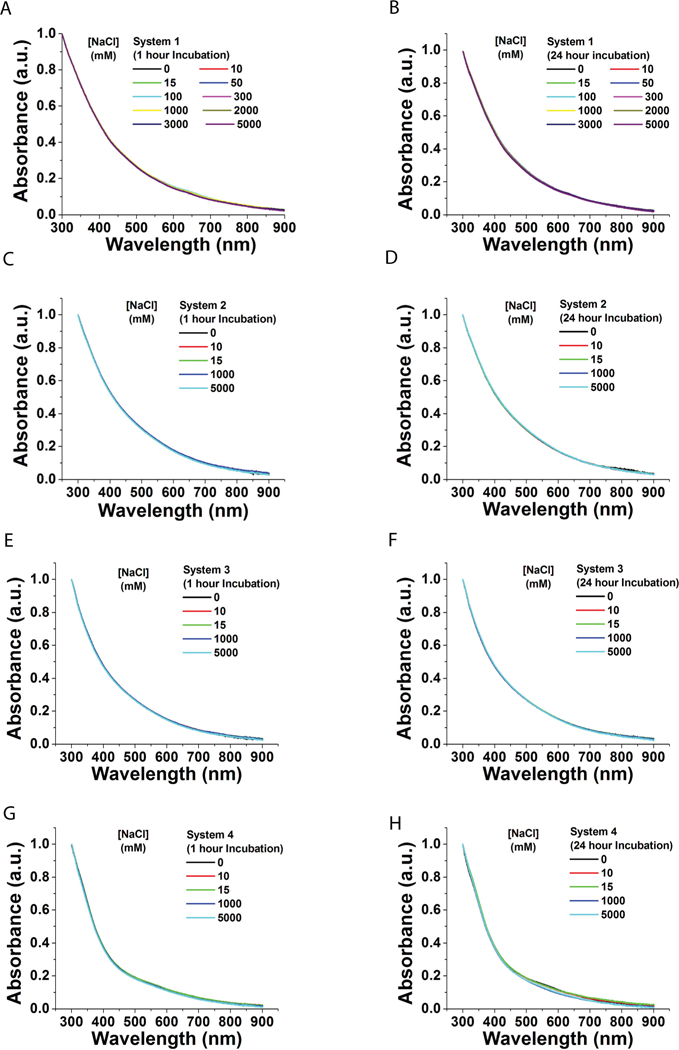
Figure 4. UV-Vis spectral analysis of AuNPs in solutions of increasing ionic strength.

A-B. System 1. (A) 1 hr (B) 24 hrs. C-D. System 2. (C) 1 hr (D) 24 hrs. E-F. System 3. (E) 1 hr (F) 24 hrs. G-H. System 4. (G) 1 hr (H) 24 hrs. All data normalized at 300 nm. NaCl solution range = 1–5000 mM. 5 mM PBS was used for dilution.
