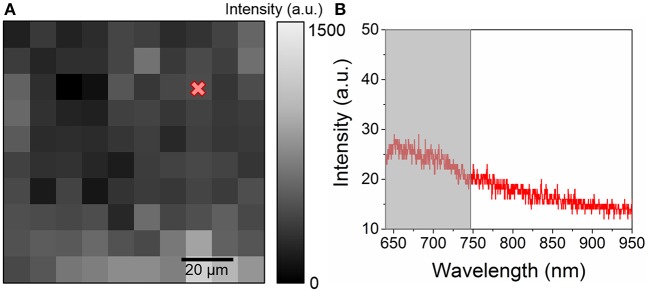
Figure 2.
(A) 100 ×100 μm2 map of the integrated intensity between 640 and 750 nm acquired with a 5 μm spatial resolution on a reference sample consisting of a fingermark on a glass cover slide with no gold NP and (B) example of a spectrum obtained from the map. The gray region indicates the integrated intensity range.

