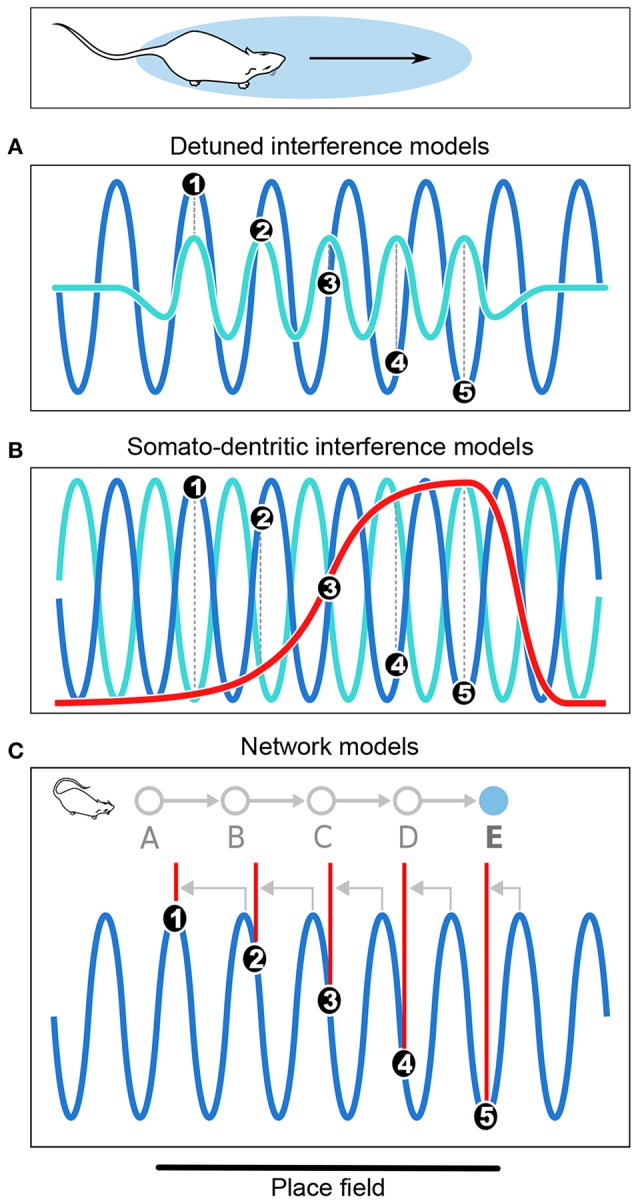
Figure 3.

Computational models of phase precession. (A) In the detuned oscillators models, the membrane potential (Vm) of the neuron (light blue) oscillates faster than the local theta rhythm (dark blue) within the firing field. Spike bursts (black dots numbered from 1 to 5) occur at positive peaks of Vm and thus anticipate theta cycles, resulting in phase precession. (B) In the somato-dendritic interference models with asymmetric excitation ramps, spikes are emitted whenever excitation (red) exceeds somatic inhibition (light blue), which is paced by theta oscillations (dark blue). Because excitation increases, it exceeds inhibition earlier and earlier, resulting in phase precession. (C) In the asymmetric connections model, successive place cells (labeled from A to E) with overlapping fields are connected (gray arrows) in such a way that activity propagates unidirectionally within the network. Thus, as the rat enters the field of cell E, it happens to be located at the center of the field of cell A. Cell A is therefore maximally excited, and transmits its activity via the chain of intermediate cells until it reaches cell E, which fires late in the theta cycle as a result of transmission delays. But as the rat progresses through the field, there are fewer and fewer intermediate steps and the transmission delays decrease, so that cell E fires earlier and earlier in the theta cycle. Note that in the present Figure, phase precession is shown from 360° to 180° to simplify the schematic representation.
