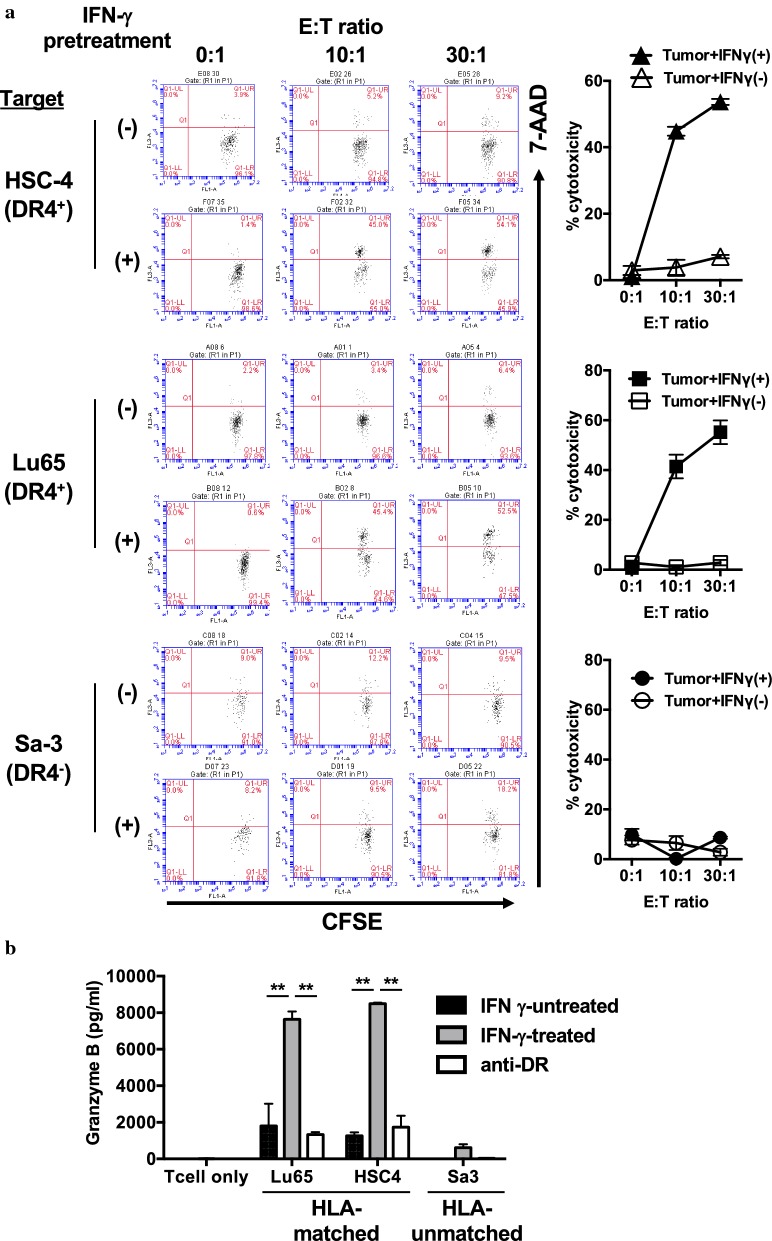
Fig. 5.
The cytotoxicity of PD-L1241-265-specific CD4+ T-cell lines against HLA-matched tumor cell lines expressing PD-L1. a PD-L1241-265-specific CD4+ T-cell lines (G1; HLA-DR4-restricted) were cocultured with CFSE-labeled tumor cell lines HSC-4 and Lu65 expressing PD-L1 pre-treated with or without IFN-γ (500 U/ml). HLA-DR-unmatched cell line Sa-3 was used as a negative control. After 6 h of coculture, the cells were collected to evaluate percentages of dead cells by using 7-AAD with flow cytometry. E:T (Effector: Target cells) ratio was 0:1, 10:1, and 30:1. Left panels show representative data of flow cytometry analysis. Right panels show the averages of cytotoxicity of the G1 cell lines against each tumor cell lines. Each result is representative of two separate experiments. b PD-L1241-265-specific CD4+ T-cell lines (G1; HLA-DR4-restricted) were cocultured with tumor cell lines HSC-4 and Lu65 pre-treated with or without IFN-γ (500 U/ml). HLA-DR-unmatched cell line Sa-3 was used as a negative control. Supernatants were collected and analyzed by ELISA for Granzyme-B release after 24 h of coculture. Bars and error bars indicate the mean and SD of triplicate determinations, respectively. Each result is representative of two separate experiments

