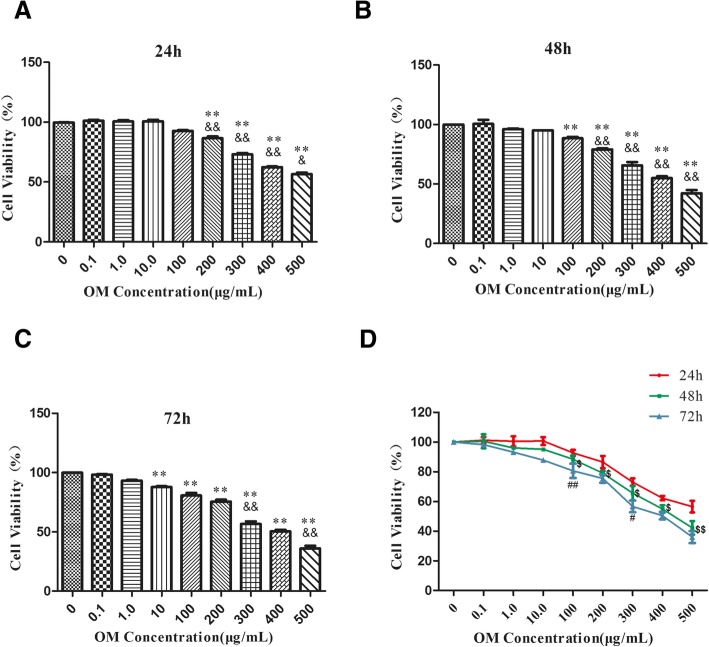
Fig. 1.
The cell vitality of HSC-T6 was tested by MTT. HSC-T6 was treated with OM(0.1 μg/mL, 1 μg/mL, 10 μg/mL, 100 μg/mL, 200 μg/mL, 300 μg/mL, 400 μg/mL and 500 μg/ml) for 24, 48 and 72 h. n = 6, Data is expressed as mean values (±SEM) in three independent experiments. a, b, c: **P < 0.01 vs control, &P < 0.05 vs previous group, &&P < 0.01 vs previous group. d: The comparison between groups in same concentration group in different time point, $P < 0.05 vs 24 h, $$P < 0.01 vs 24 h, ##P < 0.01 vs 48 h, #P < 0.05 vs 48 h

