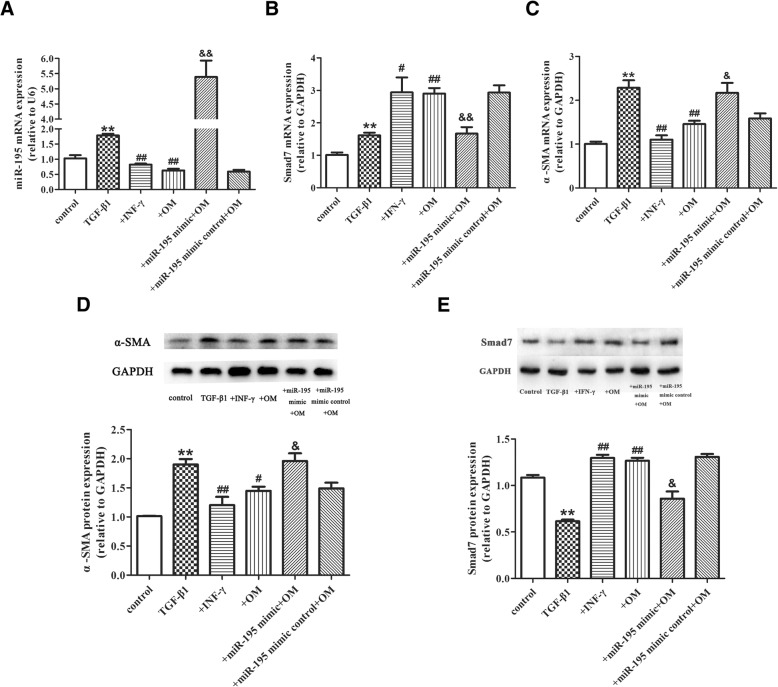
Fig. 3.
OM inhibited activation of the HSC-T6 and promoted Smad7 via miR-195. OM inhibited activation of HSC-T6 and increased Smad7 via miR-195. a Real-time PCR analysis for mRNA levels of miR-195 in HSC-T6. b Real-time PCR analysis for mRNA levels of Smad7 in HSC-T6. c Real-time PCR analysis for mRNA levels of α-SMA in HSC-T6. d Western blot analysis for protein expression of α-SMA in HSC-T6. e Western blot analysis for protein expression of Smad7 in HSC-T6. n = 3, Data is expressed as mean values (±SD) in three independent experiments.*P < 0.05 vs control, **P < 0.01 vs control, #P < 0.05 vs TGF-β1, ##P < 0.01 vs TGF-β1,&P < 0.05 vs + OM, &&P < 0.01 vs + OM. +IFN-γ: IFN-γ + TGF-β1group; +OM: OM + TGF-β1group; +miR-195 mimic+ OM: miR-195 mimic+ OM+ TGF-β1 group; +miR-195 mimic control+OM: miR-195 mimic control +OM + TGF-β1group

