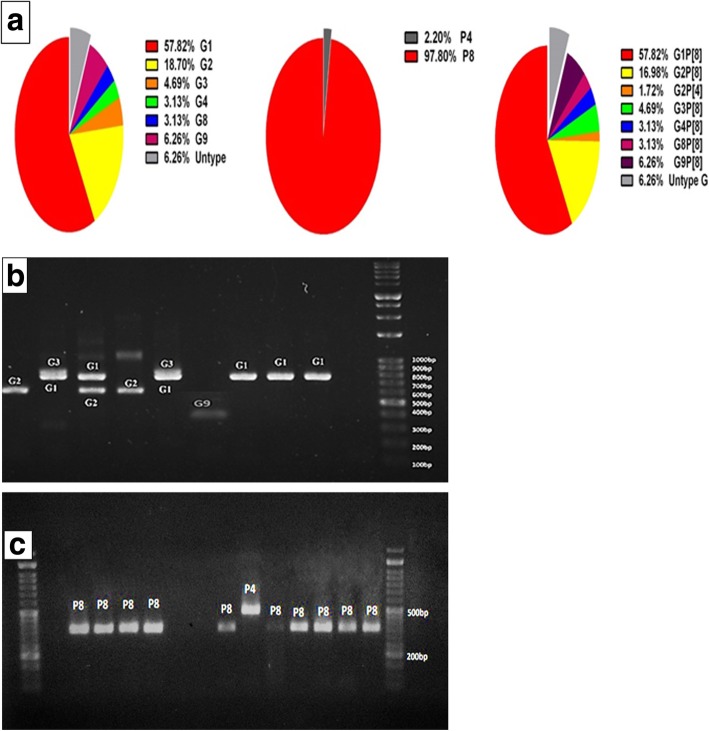
Fig. 4.
Distribution of G and P types found in 46 rotavirus-positive fecal samples in Northern Iran from 2016 to 2017. Figure 4 a Pie chart of G Genotypes, P Genotypes and combination Genotypes found in the fecal samples of acute gastrointestinal patients (denoted by their percentages). b Representative agarose gel electrophoresis of PCR products of G typing. c Representative agarose gel electrophoresis of PCR products of semi-multiplex P typing

