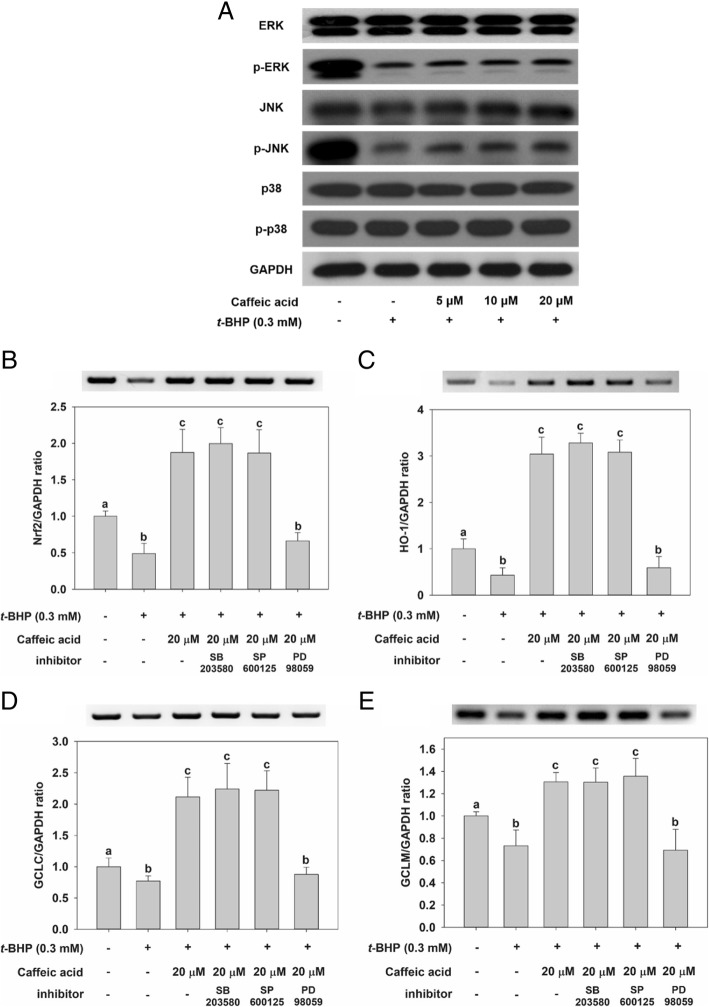
Fig. 5.
Effect of CA treatment on total expression and phosphorylation levels of ERK, JNK, and p38 in HepG2 cells. a Except for the control, in which cells were not exposed to any chemical, cells were incubated with CA (5, 10 and, and 20 μM) for 24 h, before being incubated with 0.3 mM t-BHP for 2 h. Cells were pretreated with a 10 μM concentration of MAPK-specific inhibitors for 1 h and then treated with 20 μM CA for 24 h. Cells were washed, and treated with 0.3 mM t-BHP for 2 h. RT-PCR and qRT-PCR experiments were performed to determine the amount of b Nrf2, C HO-1, d GCLC, and e GCLM mRNA found in HepG2 cells. Values are expressed as mean ± standard deviation (n = 3). Different letters indicate signification differences at p < 0.05 by Tukey’s studentized range tests

