Fig. 4.

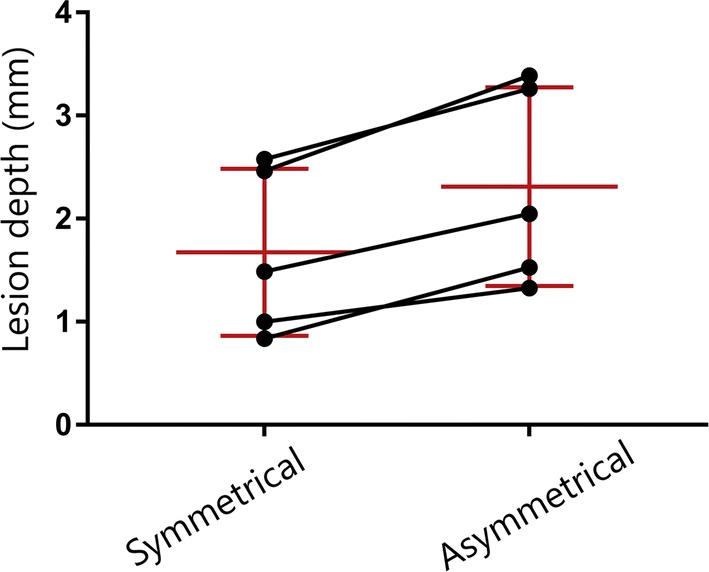
Lesion depth of the symmetrical and asymmetrical HF ablations in model M (n = 5). The black lines indicate the paired measurements; red lines indicate the mean and standard deviation per group

Lesion depth of the symmetrical and asymmetrical HF ablations in model M (n = 5). The black lines indicate the paired measurements; red lines indicate the mean and standard deviation per group