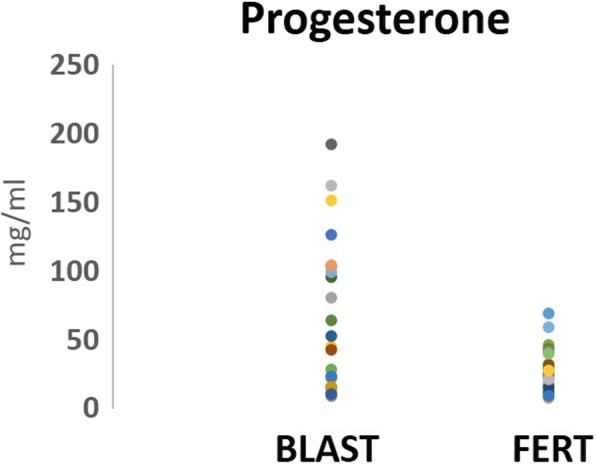
Fig. 3.

Levels of progesterone in follicular fluid. The scatter plot represents the follicular fluid progesterone levels, in group 1 (BLAST, n = 23): follicles containing oocytes that develop to blastocyst stage by day 5 and group 2 (FERT, n = 19): follicles containing oocytes that fertilised but failed to reach blastocyst stage by day 5
