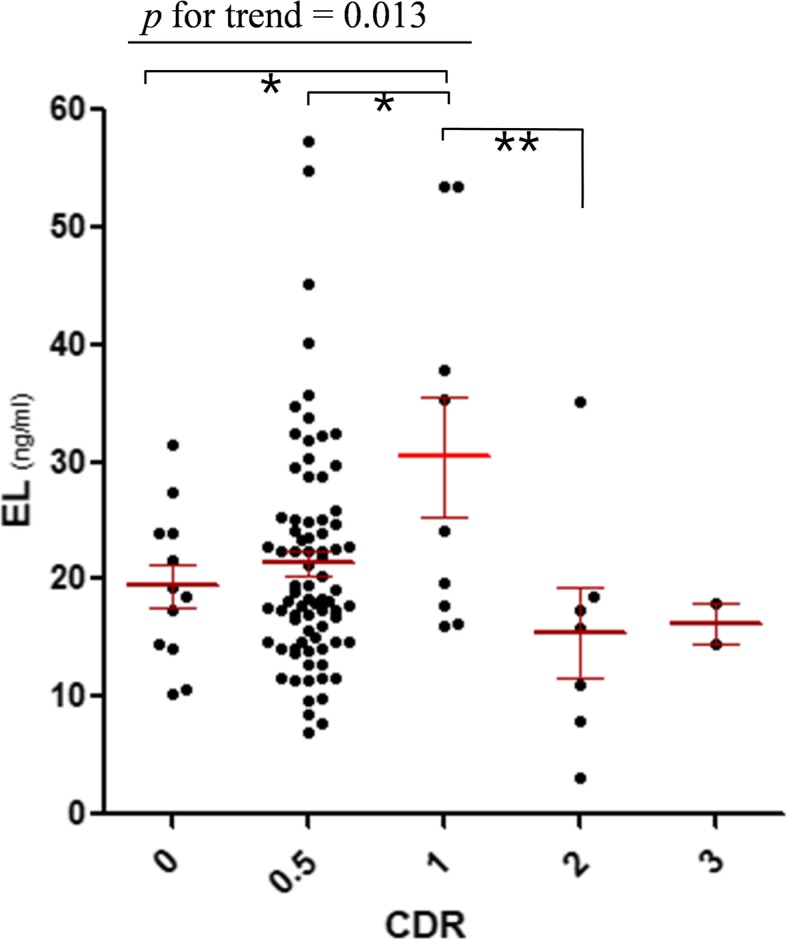
Fig. 1.

Plasma EL levels according to CDR scores. The grouped Scatter plot shows plasma EL concentrations across CDR scores. Each level is mean values of the duplicate measurement, below the coefficient of variation < 30%. Red bars represent mean ± S.E.M of each CDR group. Comparisons were made using a One-way ANOVA, followed by post-hoc analysis with the Least Significant Difference test. Significance is indicated with * and ** representing p < 0.05 and p < 0.01 respectively. The linear trend was analyzed from CDR0 to CDR1. Abbreviations: CDR, clinical dementia rating; EL, endothelial lipase
