Fig. 3.

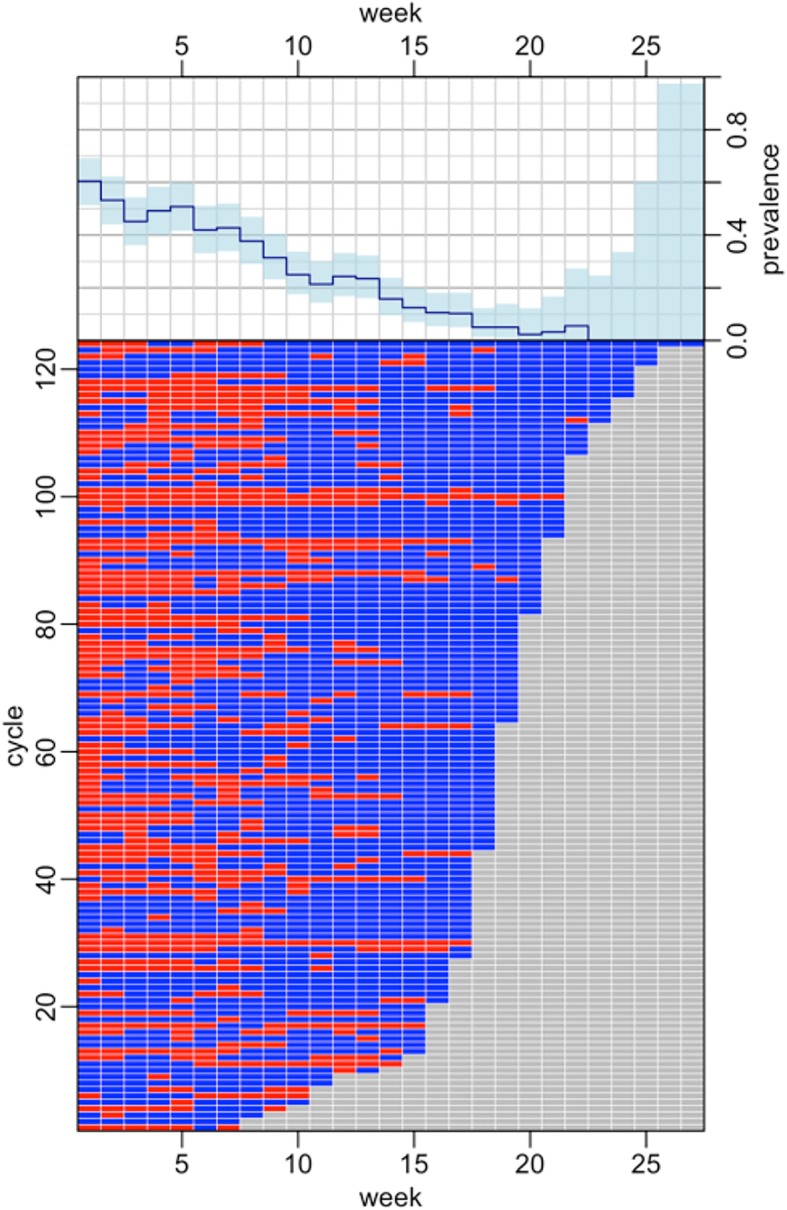
Disease episodes of over the 124 full cycles of production. Top: prevalence of clinical signs of disease on farms (with 95% confidence interval), by week. Bottom: production weeks with (red) and without (blue) disease episode

Disease episodes of over the 124 full cycles of production. Top: prevalence of clinical signs of disease on farms (with 95% confidence interval), by week. Bottom: production weeks with (red) and without (blue) disease episode