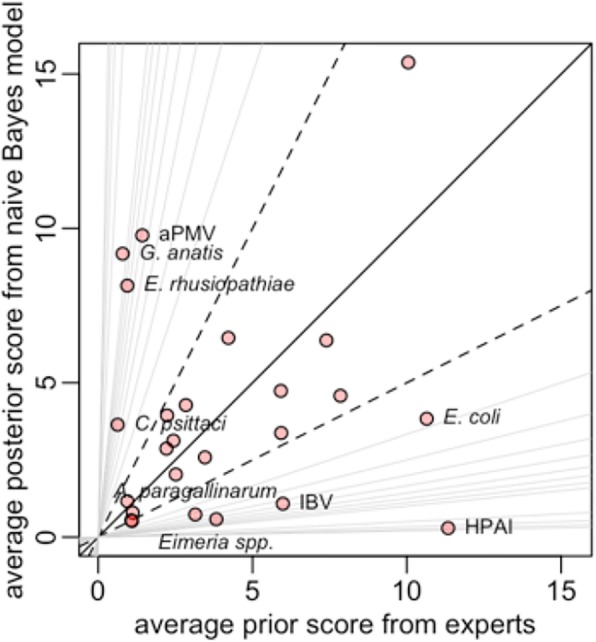
Fig. 4.

Relationship between prior estimates from veterinary expert opinion and posterior probabilities predicted by the naïve Bayes model. Lines above the diagonal have slopes increasing from 2 (black dashed line), 3, … 10, 20, …50 (all grey lines). Similarly, lines below the diagonal have slopes decreasing from ½ (black dashed line), 1/3, … 1/10, 1/20, … 1/50 (all grey lines)
