
Fig. 5.
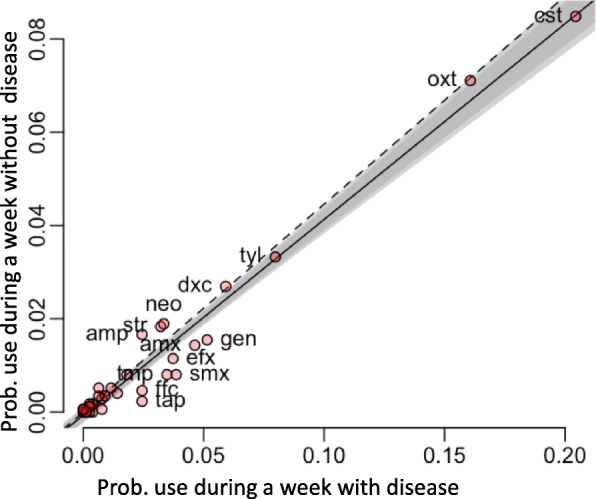
Probability of use of antimicrobial active ingredients in weeks with and without disease. Relationship, for each antimicrobial, between the probability of use during a week with disease and without disease. The black line is the regression line and the light and grey areas are the 99 and 95% confidence intervals respectively. The dashed line is the expected relationship in case there is no difference of usage between the weeks with and without disease (the slope is equal to the ratio of weeks with and without disease). cst = colistin, oxt = oxytetracycline, tyl = tylosin, dxc = doxycycline, neo = neomycin, gen = gentamicin, str = streptomycin, amp = ampicillin, amx = amoxicillin, gen = gentamicin, efx = enrofloxacin, tmp = trimethoprim, smx = sulfamethoxazole, ffc = florfenicol, tmp = thiamphenicol