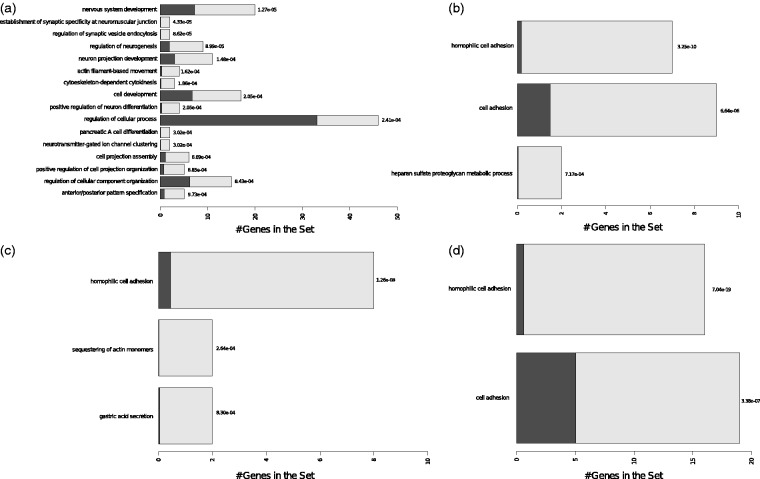
Figure 4.
Graphical representation of the enriched biological processes (BPs) modulated by the downmodulated miRNAs. (a) BPs for miR-361-3p targets. (b) BPs for miR-190b targets. (c) BPs for miR-522 targets. (d) BPs for miR-299-5p targets. Overrepresented pathways are depicted in the y-axis. The bars represent the expected (dark bars) versus the observed numbers of genes (gray light bars) for each BP enrichment with the statistical difference values alongside the bars. The overrepresentation was assessed with a statistical score based on hypergeometric tests with p ≤ .001. Complete list including the full names of the GO terms is presented in Supplemental Table S4.

