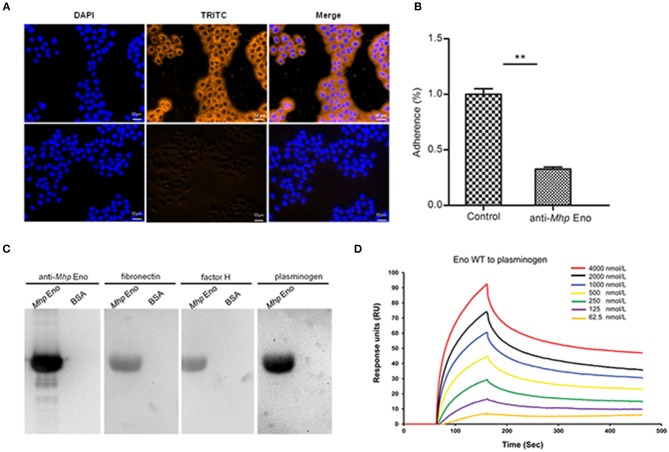
Figure 2.
Role of Mhp Eno in the adhesion of M. hyopneumoniae to STECs. (A) Blue indicates STEC nuclei. The color orange in the first row indicates the adherence of Mhp Eno to STEC membranes, and the second row indicates the adherence of BSA (negative control) to STEC membranes. The white line indicates the scale. (B) Adhesion rate = (number of bacteria recovered from cells incubated with the anti-Mhp Eno sera / number of bacteria recovered in the group incubated with the preimmune sera) × 100. The data are expressed as the means ± SDs of at least three experiments with samples performed in triplicate. (C) Analysis of the interaction of Mhp Eno with fibronectin, factor H and plasminogen by far-WB. First lane: PVDF membrane with transferred Mhp Eno protein incubated with anti-Mhp Eno antibody as a positive control; second lane: PVDF membrane with transferred BSA (negative control) incubated with anti-Mhp Eno antibody; third lane: PVDF membrane with transferred Mhp Eno protein incubated with fibronectin and anti-fibronectin antibody; fourth lane: PVDF membrane with transferred BSA (negative control) incubated with fibronectin and anti-fibronectin antibody; fifth and sixth lanes: PVDF membrane with transferred Mhp Eno protein and BSA incubated with factor H and anti-factor H antibody; and seventh and eighth lanes: PVDF membrane with transferred Mhp Eno protein and BSA incubated with plasminogen and the anti-plasminogen antibody. The protein bands were visualized using the ECL substrate. (D) Gradient concentrations of Mhp Eno enolase ranging from 62.5 to 4,000 nmol/L flow through immobilized plasminogen in an SPR assay. The protein concentrations were consistent with the color lines. RU, resonance units.

