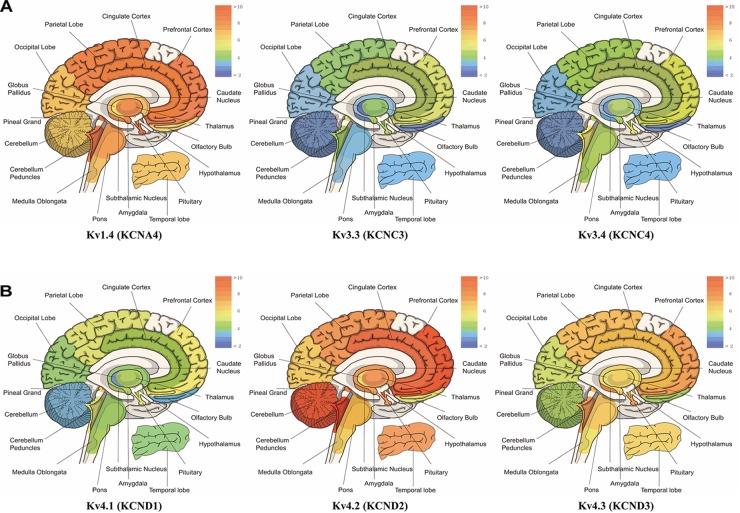
FIGURE 1.
mRNA expression levels of panel (A) kcna4 (Kv1.4), kcnc3 (Kv3.3), and kcnc4 (Kv3.4), panel (B) kcnd1 (Kv4.1), kcnd2 (Kv4.2), and kcnd3 (Kv4.3). The microarray data have the mean value of each probe-set data obtained from BIOGPS (http://www.biogps.org), showing the tissue-specific pattern of mRNA expression according to GeneAtlas U133A, gcrma (Su et al., 2004). Note that expression of Kv1.4 is elevated in prefrontal cortex, cerebellum peduncles, pituitary and pineal gland; Kv3.3 in prefrontal cortex, pineal gland, pituitary, cerebellum peduncles; Kv3.4 in cerebellum peduncles, pituitary, prefrontal cortex and pineal gland; Kv4.1 in pineal gland, prefrontal cortex, pituitary and cerebellum peduncles; Kv4.2 in cerebellum peduncles, cerebellum, and prefrontal cortex and hypothalamus; Kv4.3 in subthalamic nucleus, pineal gland, cerebellum peduncles, pituitary and prefrontal cortex (when only top 25% of expression levels is considered).

