Figure 1.
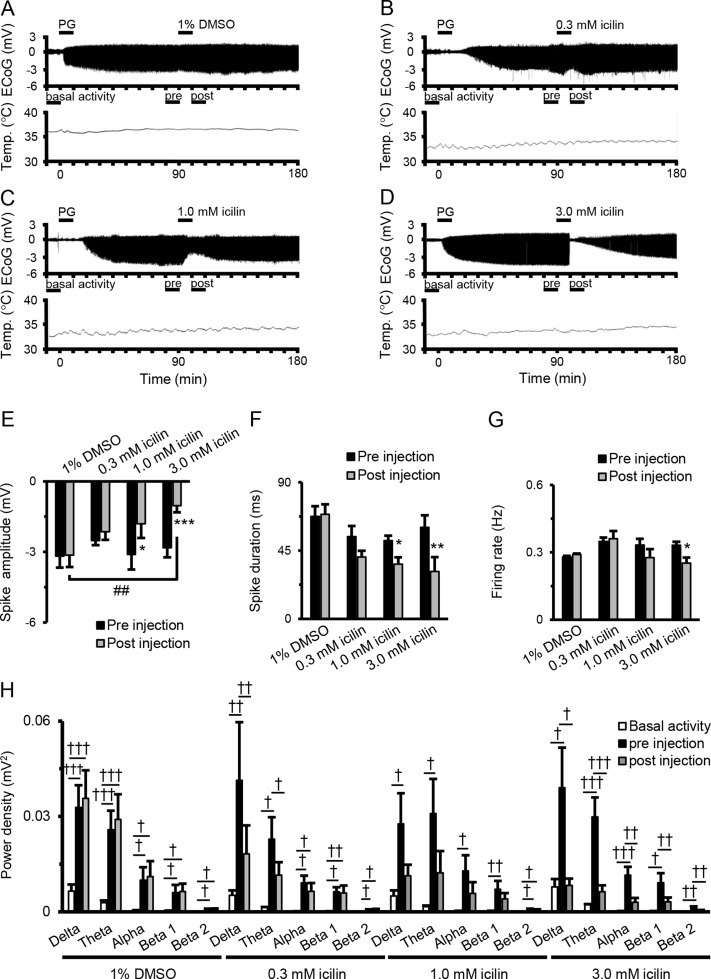
Suppressive effects of icilin on components of EDs. Examples of changes in ED and cortical temperature with (A) PG + 1% DMSO, (B) PG + 0.3 mM icilin, (C) PG + 1.0 mM icilin, (D) PG + 3.0 mM icilin. (A–D) Each bar indicates the duration of ECoG analysis during basal activity, and preinjection and postinjection. (E) Spike amplitude, (F) spike duration, and (G) firing rate during the preinjection (black) and postinjection (gray) periods with PG + 1% DMSO (n = 7), PG + 0.3 mM icilin (n = 7), PG + 1.0 mM icilin (n = 7), and PG + 3.0 mM icilin (n = 7). (H) ECoG power during basal activity (white), and the preinjection (black) and postinjection (gray) periods for each frequency band. The results are shown as mean ± SEM; *p < 0.05, **p < 0.01, ***p < 0.001, paired t-test; † p < 0.05, †† p < 0.01, ††† p < 0.001, one-way analysis of variance followed by Tukey’s test; ## p < 0.01 vs PG + 1% DMSO group, followed by Dunnett’s test. ED, epileptiform discharge; PG, penicillin G; DMSO, dimethyl sulfoxide; ECoG, electrocorticogram; SEM, standard error of the mean.

