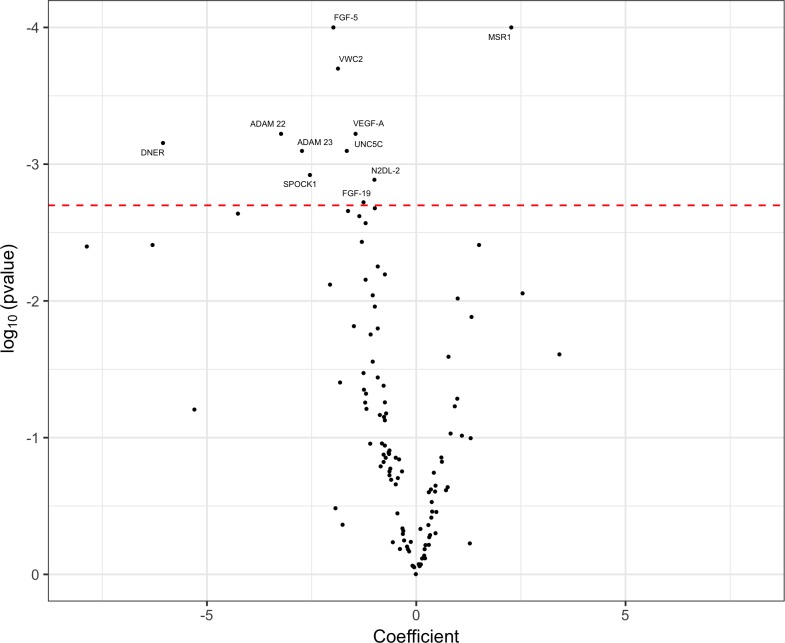
Figure 1.
Volcano plot of cerebrospinal fluid proximity extension assay biomarkers, highlighting significant markers that differentiated the atypical parkinsonian syndromes (APS) group from controls. Markers to the right of 0 on the x-axis were higher in the APS group and markers to the left of 0 on the x-axis were higher in controls. The threshold for p value significance (<0.002) was set using the Benjamini-Hochberg correction method for multiple testing with a false discovery rate of 5%.

