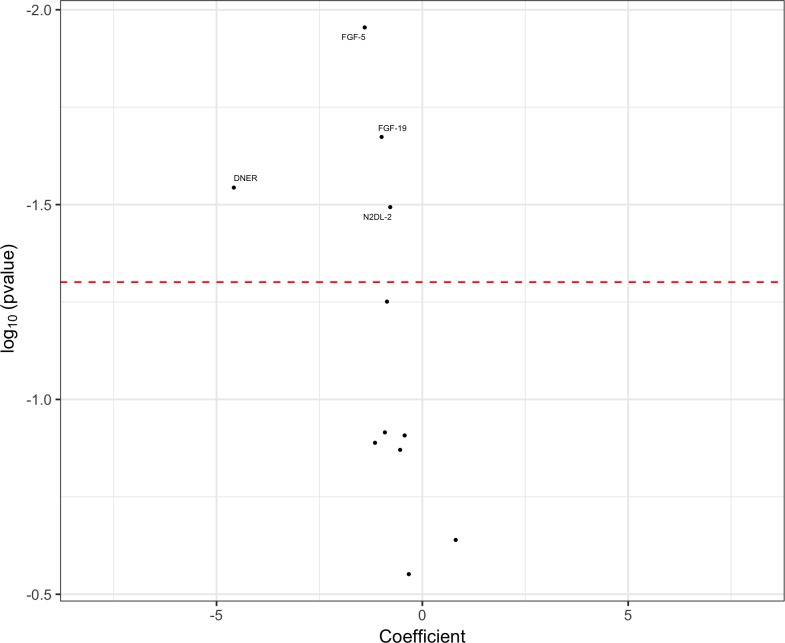
Figure 2.
Volcano plot of cerebrospinal fluid proximity extension assay biomarkers, highlighting significant markers that differentiated the atypical parkinsonian syndromes (APS) group from the Parkinson’s disease (PD) group. Markers to the right of 0 on the x-axis were higher in the APS group and markers to the left of 0 on the x-axis were higher in the PD group. The threshold for p value significance (<0.05) was set using the Benjamini-Hochberg correction method for multiple testing with a false discovery rate of 5%.

