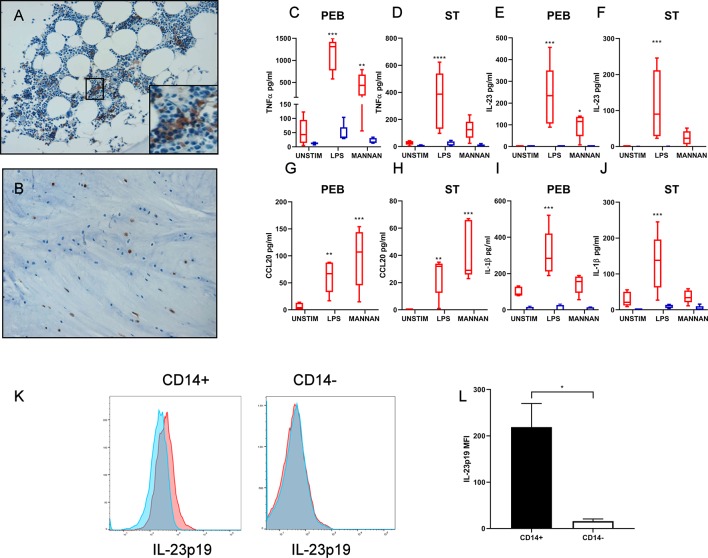
Figure 1.
Immunohistochemistry of CD14+ cells in (A) perientheseal bone (PEB) and (B) entheseal soft tissue (ST). Enthesis samples were separated into PEB and ST and CD14+ and CD14− cells sorted. (C–J) CD14+ and CD14− fractions were stimulated with LPS/interferon gamma (IFNү) or mannan for 48 hours. TNF, IL-23, CCL20 and IL-1β levels were measured by ELISA. n=5. Two-way analysis of variance (ANOVA) with Bonferroni multiple comparisons test was performed. *Significance from relevant unstimulated control, for example, CD14+ or CD14− unstimulated. (K) PEB was stimulated with LPS/IFNү in the presence of Golgi plug for 16 hours. Cells were surface stained for CD14+ and CD14− cells and intracellular IL-23p19 were measured. Blue histograms represent unstimulated and red stimulated. (L) Change in IL-23p19 median fluorescence intensity (MFI), following LPS/IFNү stimulation in both CD14+ and CD14− gates. n=3. Paired t-test. *p<0.05; **p<0.01; ***p<0.001. IL, interleukin; LPS, lipopolysaccharide; PEB, perientheseal bone; ST, soft tissue; TNF-α, tumour necrosis factor alpha.

