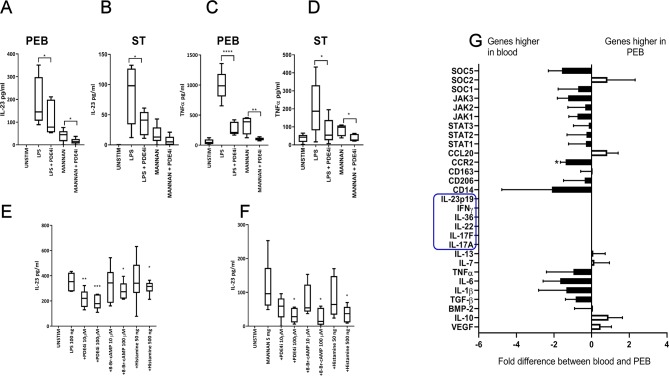
Figure 2.
(A–D) CD14+ fraction cells were isolated from the PEB and ST as before (n=5), and stimulated with LPS/IFNү and mannan as before, with and without PDE4I rolipram, IL-23 and TNF were measured by ELISA. (E, F) Healthy blood CD14+ cells were stimulated with LPS/IFNү (E) or mannan (F) with and without cAMP-elevating agents; rolipram, 8-Br-cAMP and histamine for 48 hours (n=7), IL-23 secretion was measured by ELISA. One-way analysis of variance (ANOVA) with Bonferroni multiple comparisons test was performed. (E, F) Significance from stimulated (LPS or mannan). (G) CD14+ cells were isolated from the PEB or matched blood and transcript analysis was performed (n=4). Black bars represent those higher expressed in blood, white bars those with higher expression in PEB. Genes highlighted in blue were undetectable in both blood and PEB. A paired t-test was performed on ΔCt values for PEB versus blood. *p<0.05; **p<0.01; ***p<0.001. IFN, interferon; IL, interleukin; LPS, lipopolysaccharide; PEB, perientheseal bone; ST, soft tissue; TNF, tumour necrosis factor; VEGF, vascular endothelial growth factor.

