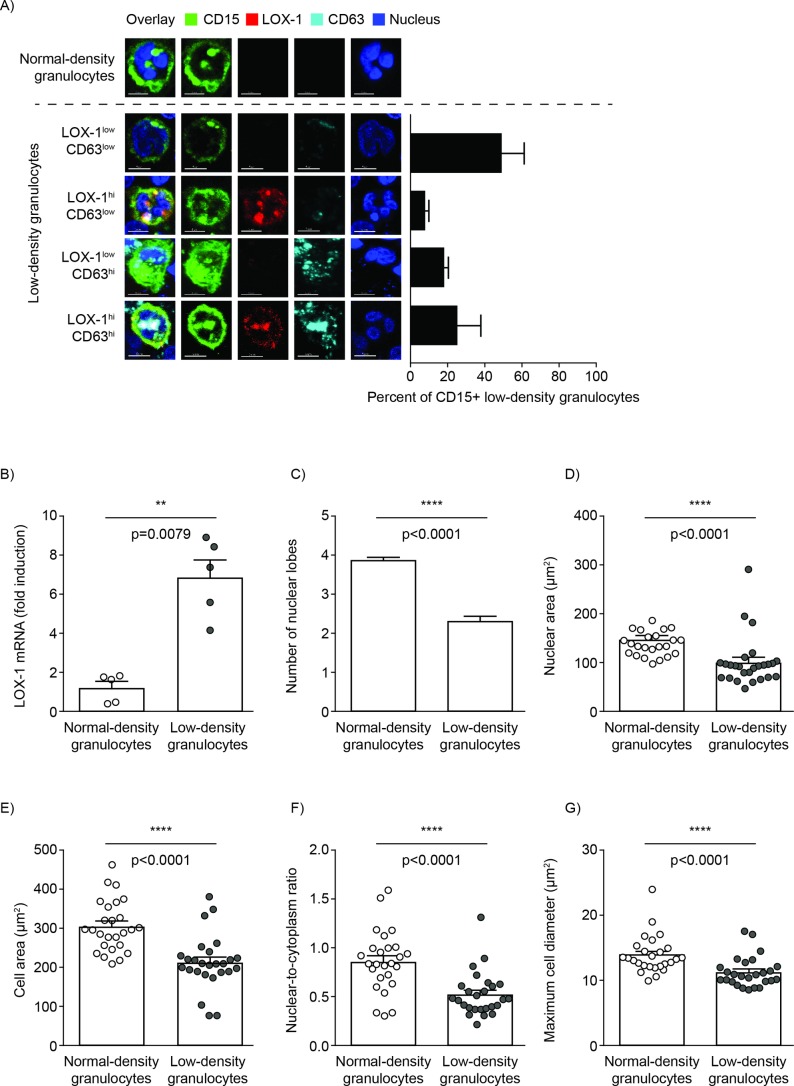
Figure 3.
SLE LDG express LOX-1 and demonstrate different morphology compared with autologous NDG. (A) Representative confocal images of autologous SLE NDG and LDG and relative percentage of LDG subgroups. The LOX-1hi/CD63hi population was further characterised for morphology (data representative of five patients with SLE). (B) LOX-1 mRNA expression levels in SLE NDG and LDG (data representative of five patients with SLE). (C–G) Quantitative comparative assessment of various morphological parameters between SLE NDG and LOX-1hi CD63hi LDG population, (C) number of nuclear lobes, (D) nuclear area (NDG mean±SEM=160±7.4 µm2; LDG mean±SEM=101±3.4 µm2; p<0.0001), (E) cell area (NDG mean±SEM=315±14.6 µm2; LDG mean±SEM=245±9 µm2; p<0.0001), (F) nuclear-to-cytoplasm ratio (NDG mean±SEM=0.89±0.07; LDG mean±SEM=0.6±0.03; p<0.0001) and (G) cell diameter (NDG mean±SEM=14±0.72 µm; LDG mean±SEM=11.7±0.41 µm; p<0.0001). Data pooled from five patients with SLE with individual symbol representing one cell and the mean±SEM is shown. Scale bar per image is 10 µm. LDG, low-density granulocytes; LOX-1, lectin-like oxidised low-density lipoprotein receptor-1; NDG, normal-density granulocytes; SLE, systemic lupus erythematosus.

