Figure 2.
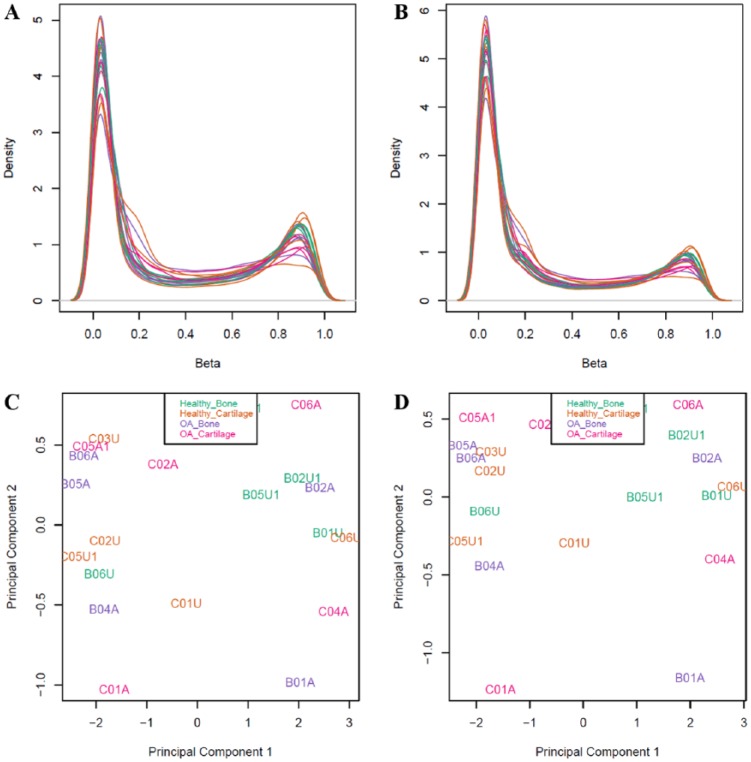
(A and B) Density plots of β values after normalization and probe filtering using the alignment filter criteria (A) or the gene symbol filter criteria (B). (C and D) Multidimensional scaling plots showing the first 2 principal components that describe genome-wide methylation variation after normalization and filtering using the alignment filter criteria (C) or the gene symbol filter criteria (D). Each point represents one sample that is either from healthy bone, healthy cartilage, OA bone, or OA cartilage. In the multidimensional scaling plots, these categories do not form distinct clusters.

