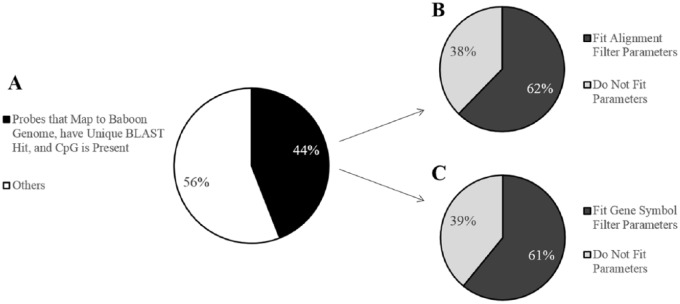
Figure 3.
Filtering effects on the 450K array probes for baboons. (A) Pie chart showing the percent of 450K array probes that map to the baboon (Papio anubis) genome with e-values less than e−10, have only unique BLAST hits, and target a CpG site. Out of 485,512 probes total, 213,858 probes (44%) meet these criteria. (B) Pie chart showing the percent of probes, out of those that successfully mapped to the baboon genome, that contain 0 mismatches in 5 bp of the probe by and including the targeted CpG site and 0 to 2 mismatches in 45 bp of the probe not including the CpG site. Out of the 213,858 mapped probes, 133,264 probes (62%) meet these criteria. (C) Pie chart showing the percent of probes, out of those that successfully mapped to the baboon genome, with gene symbol matches to humans. Out of the 213,858 mapped probes, 130,307 probes (61%) meet these criteria.

