
Figure 2.
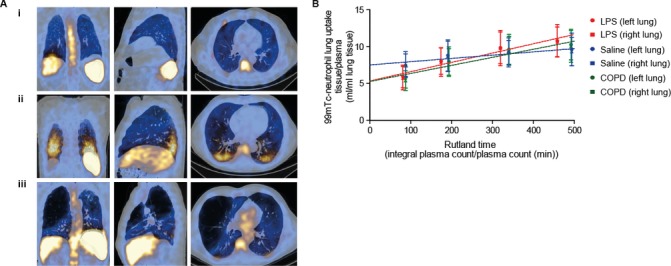
SPECT/CT and Patlak-Rutland analysis. Panel A shows a two-dimensional representation (coronal, sagittal and transverse views, respectively) of a reconstructed 45 min SPECT/CT scan in (i) a saline-challenged HV, (ii) an LPS-challenged HV and (iii) a patient with COPD. Peak areas of radioactivity are seen as yellow/white, with lower levels in blue. The large airspaces, with negligible radioactivity, are black and can be seen in the emphysematous lung (iii). Panel B shows the composite Patlak-Rutland graphical plot (±SD) in saline- challenged HVs (n=6), LPS-challenged HVs (n=12) and patients with COPD (n=20) (V1). For visual purposes the right and left lungs have been displayed separately. The plot gradient represents blood clearance of 99mTc-neutrophils to the lungs in mL/min/mL lung volume. The y-axis intercept corresponds to the 99mTc-neutrophil distribution volume. 99mTc, 99mTechnetium; HV, healthy volunteer; LPS, lipopolysaccharide; SPECT, single-photon emission CT.